After reviewing how to debug the DOM in the first part of our overview of Chrome Devtools, in this second part we will have a look at the Console. A Console tab is available both as a main tab at the top of the Devtools and as a drawer at the bottom of all the other tabs. Both versions are identical and they provide the same features.
The Console allows you to type some JavaScript code, evaluate it and see the result directly. It is thus possible to inspect and manipulate the current document quickly. It also offers content assist to help you type your expressions along with JavaScript and DOM elements formatting and navigation. With this, you can dive into all the properties of the elements returned by your expressions.
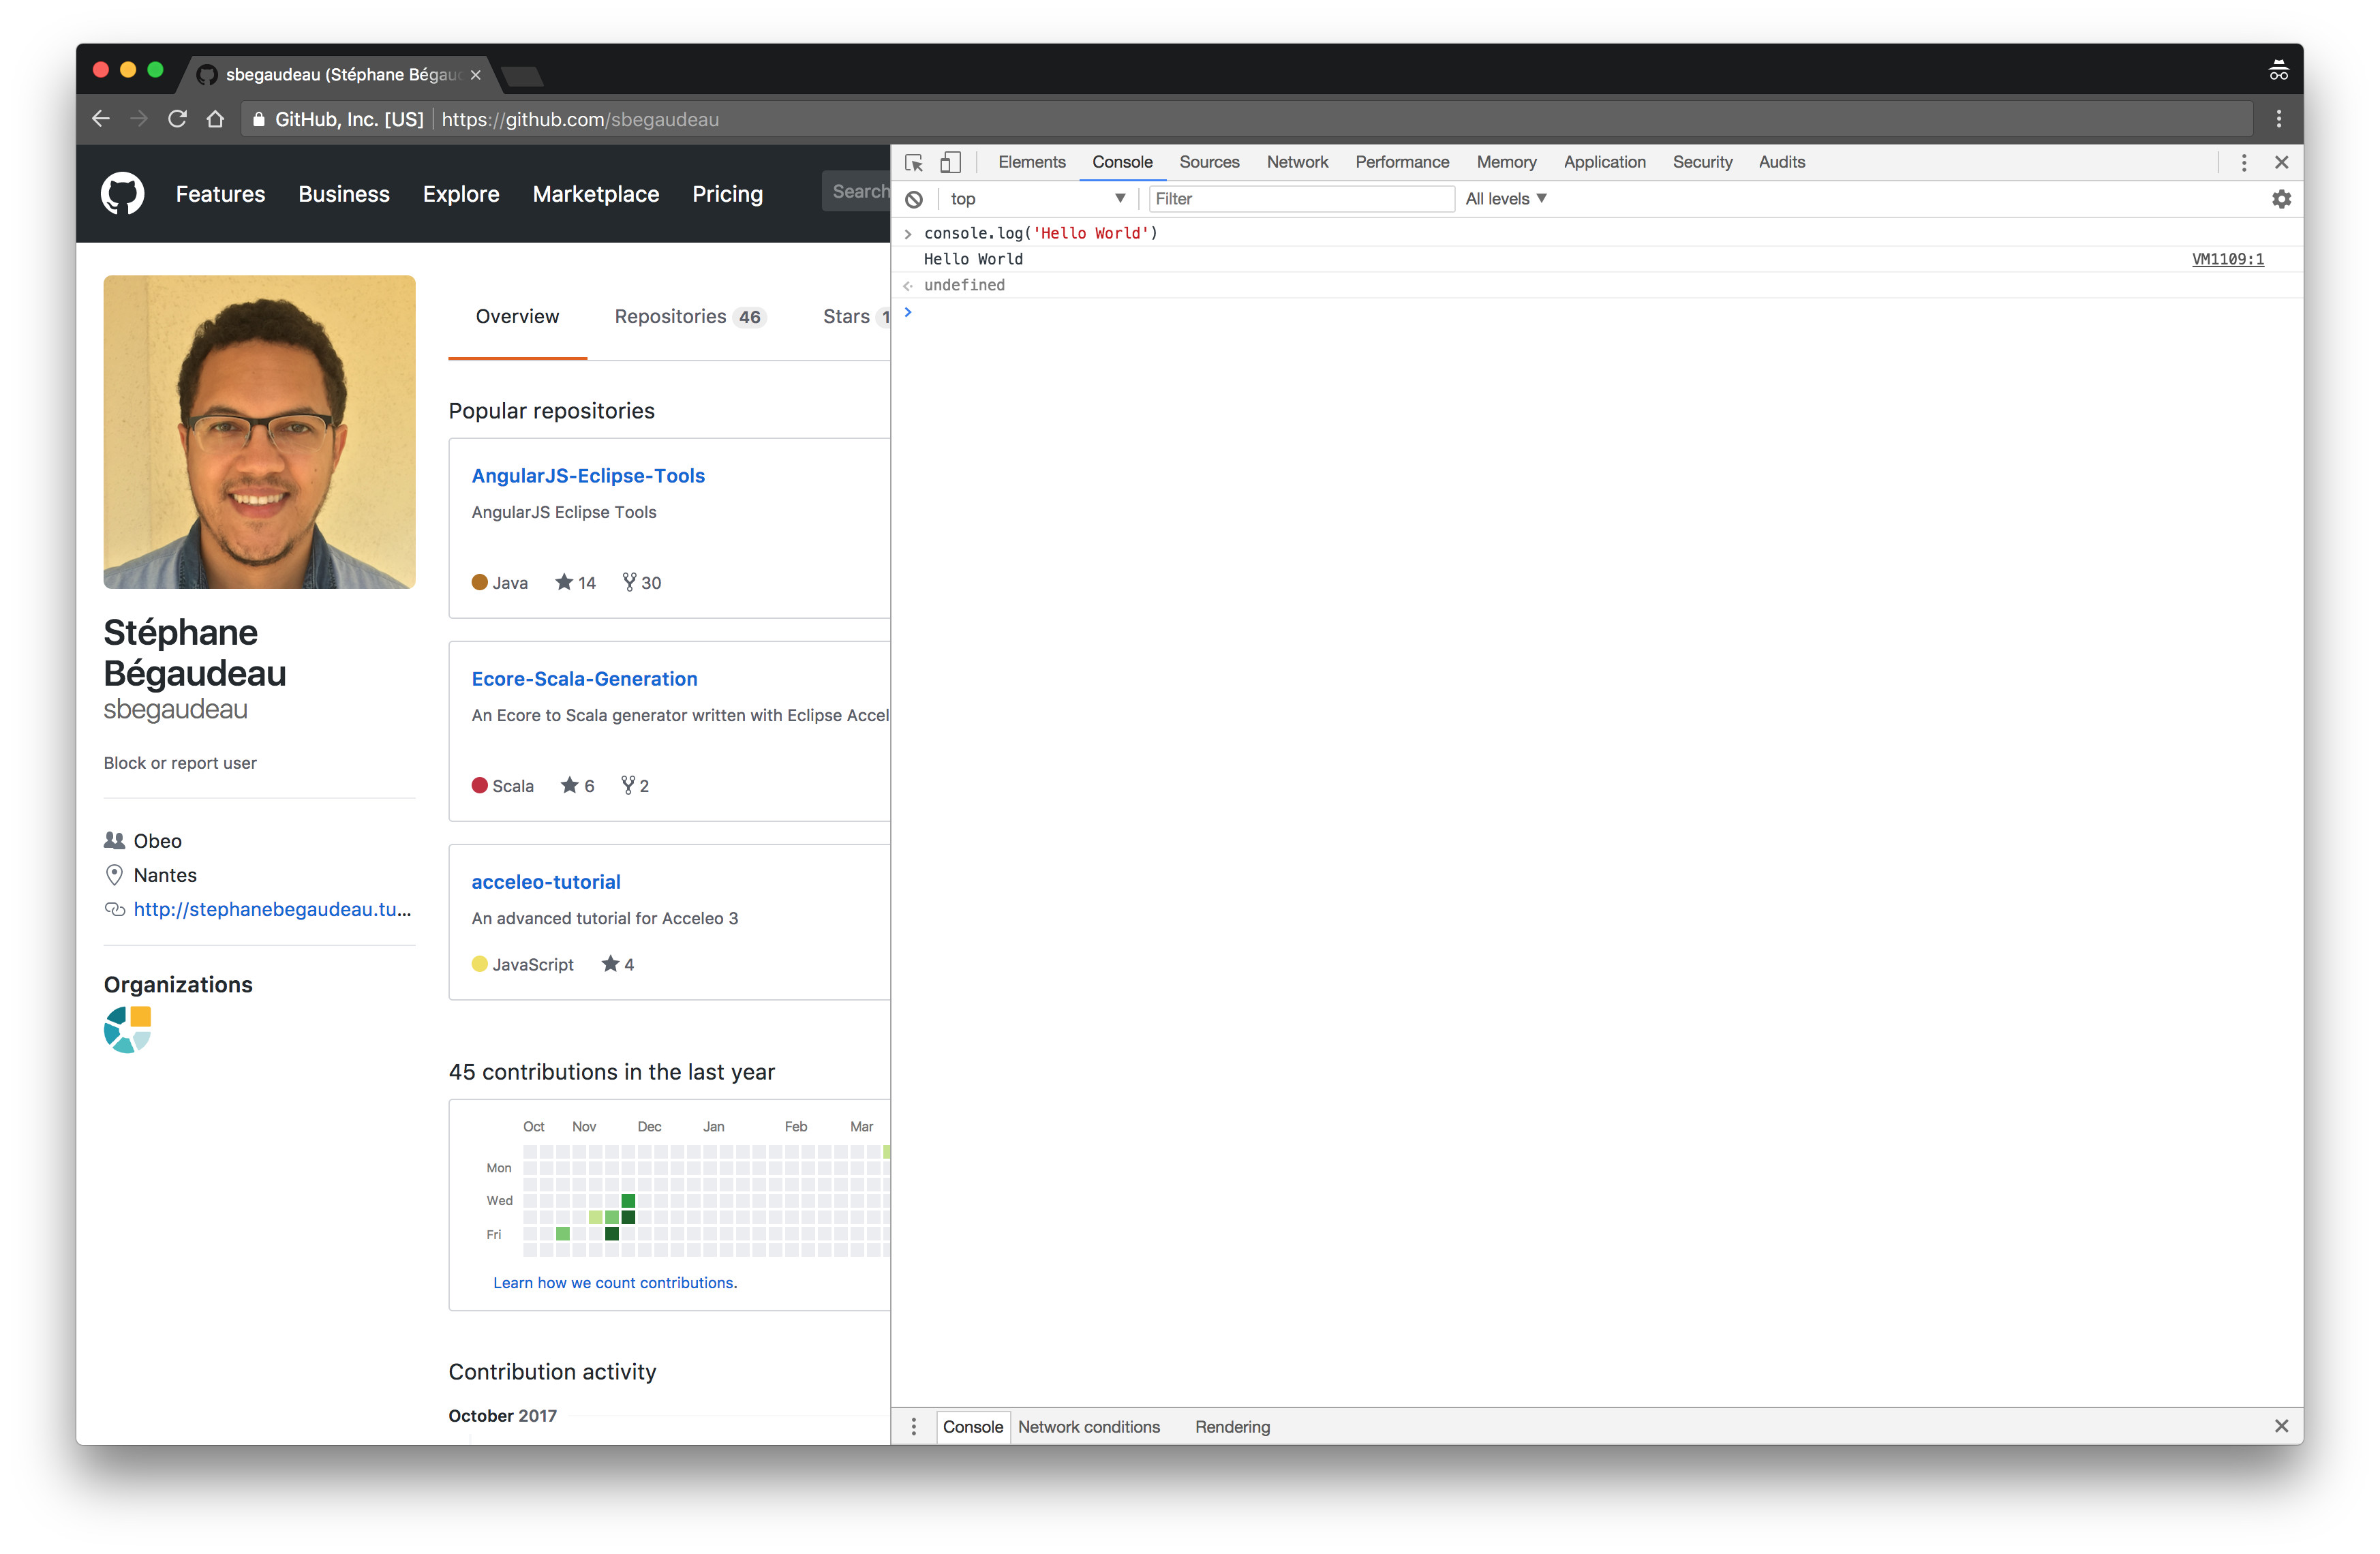
The console object lets you programmatically log some content (any JavaScript value or any DOM elements for example), using console.log('Hello World'). The Console can be cleared programmatically with the expression console.clear(). The shortcut Ctrl + L is also available to clear it manually.
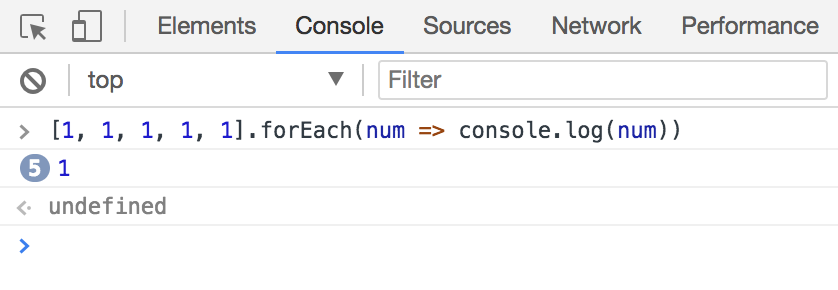
If you log the same message multiple times in a row, the Console will stack those messages and display a counter next to the first one. For example, the expression [1, 1, 1, 1, 1].forEach(num => console.log(num)) would only create one message 1 with a small badge indicating that it has been logged five times in a row.
To make the Console appear in another tab, use the dedicated menu in Customize and control Devtools or the Esc shortcut. If you want to save the content logged, right-click in the Console and save what has been logged in a file on your computer.
In the settings of the Console, several options are available to hide network messages or on the contrary log all XMLHttpRequests. You can also preserve log between pages while refreshing. It is possible to filter the Console with the various log levels (verbose, info, warning, and error). A text field is also available to filter the Console by keeping only the content matching some query. A small hint will indicate the number of messages hidden by the filters and in the settings, the display of the timestamp of each message logged can be activated.
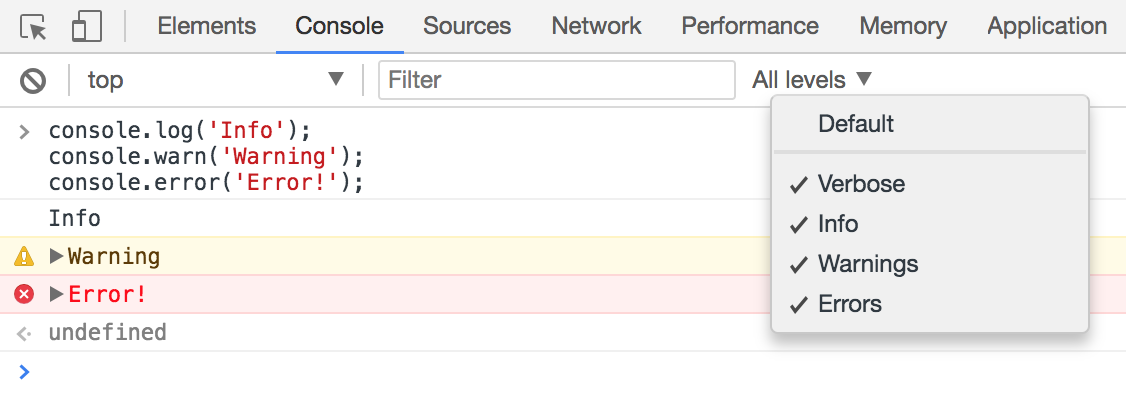
Various functions are available to select the severity of the message to be logged with console.warn() or console.error(). You can also change the context used for the execution of the Console to switch it to a different IFrame or to debug a running Chrome extension. By default, the Console will execute your expressions in the top context of the page.
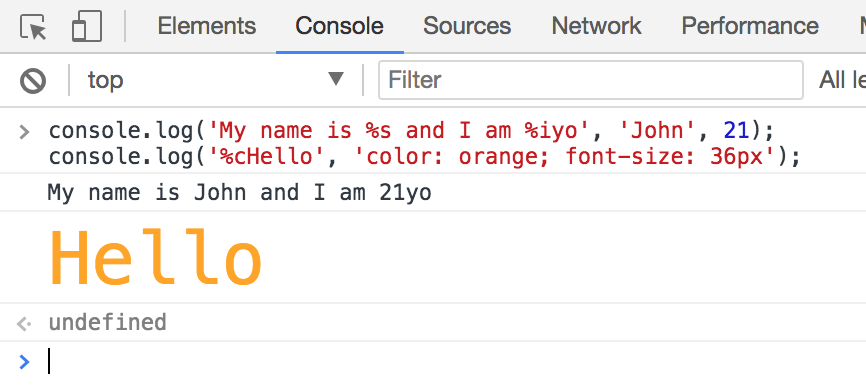
The Chrome Devtools Console contains an impressive amount of advanced features. You have access to string substitution while logging with, for example, %s for strings and %i for numbers and it is also possible to apply CSS to the content logged with %c.
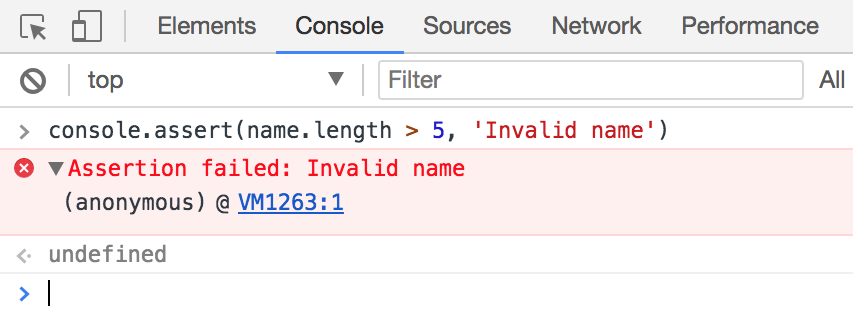
You can log a message conditionally with console.assert(predicate, message). In this situation, the message will be logged only if the predicate returns a falsy value. As such, console.assert(name.length > 5, 'Invalid name') would log an assertion failed error if the name is too short.
With Shift + Enter a new line will be entered in the Console allowing you to easily specify multiline expressions to be executed.
Groups
In order to prevent the Console from being cluttered with logs, you can create groups of messages and even nested groups with console.group(name) and console.groupEnd().
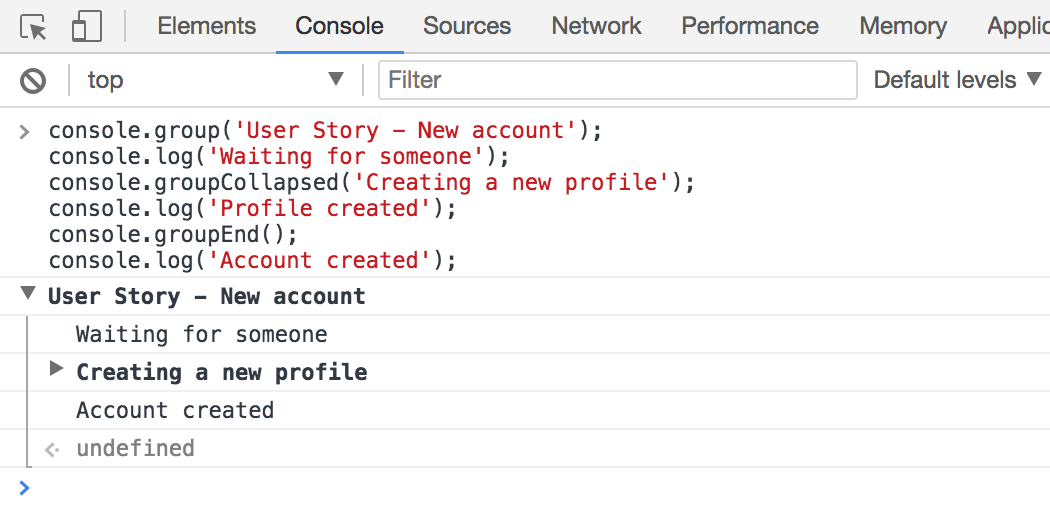
It is possible to collapse groups to hide useless logs. On top of that, groups can be created collapsed by default with console.groupCollapsed(name).
Table
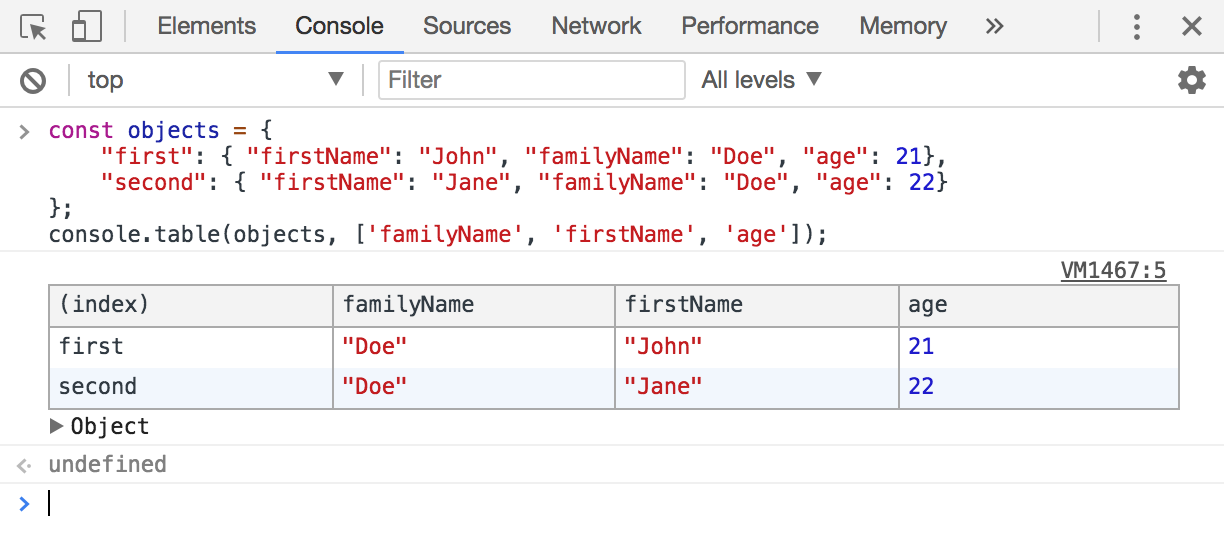
To visualize complex sets of data, the Console can also display tables thanks to console.table(data, columnNames). You just need to give it an array or an object as the data and the name of the columns to display. A small table can be displayed with the following example:
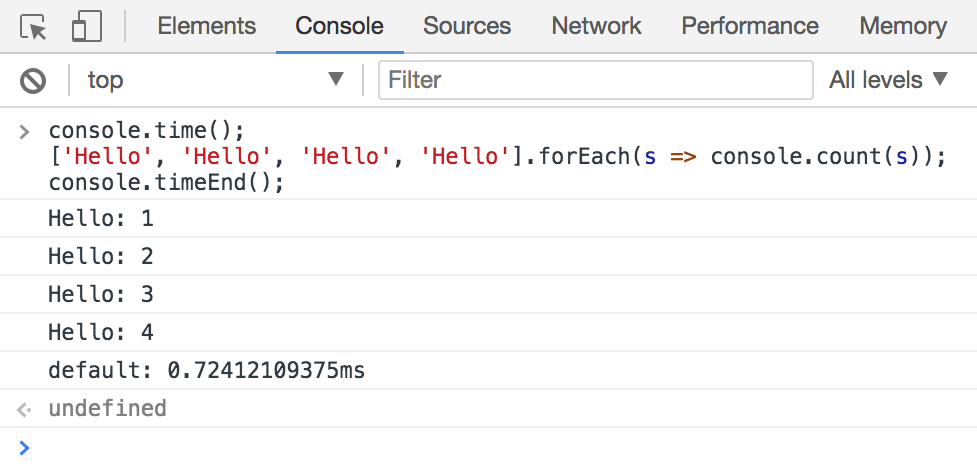
The Console allows you to log the time taken by some actions with console.time(name) and console.timeEnd(name). You can also count the number of time something has been logged with console.count(msg). This is especially useful when a bug appears in the middle of a complex iteration.
Events & Profiling
The Console allows you to monitor events with monitorEvents(e, types) where e is the DOM element to monitor and types is the type of events expected or an array of type expected.
For example with monitorEvents(document.body, ['click']);, all clicks will be logged in the Console. You can unregister this listener with unmonitorEvents(document.body, ['click']).
If you want to have a look at the listeners registered on a specific DOM element, use the function getEventListeners(e). This function will return an object using the types of event as keys and an array of all the listeners found for this event as value.
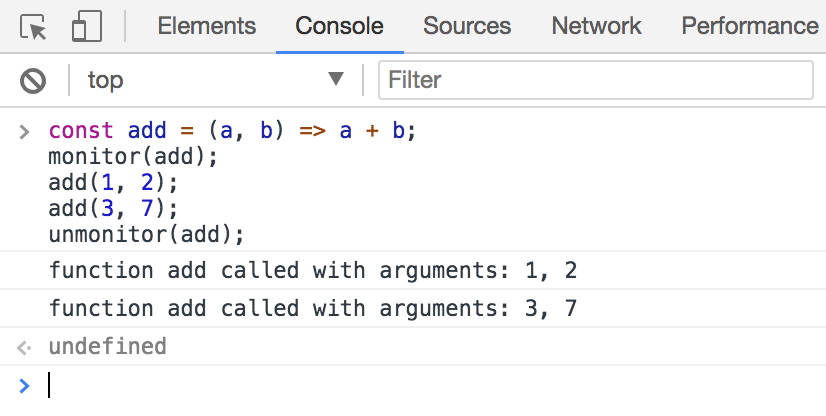
You can also monitor the execution of function with monitor(f) and unmonitor(f). Thanks to this, a monitored function will log a message when it is executed indicating that it has been called along with the arguments used.
You also have the ability to programmatically start and stop a profiling session in order to evaluate the memory consumption of a piece of code. For that, use profile() and profileEnd(). We will see more about profiling in Chrome Devtools in another post.
Misc
When you are stopped on a breakpoint or in the middle of a script, you can display the current stack trace with console.trace().
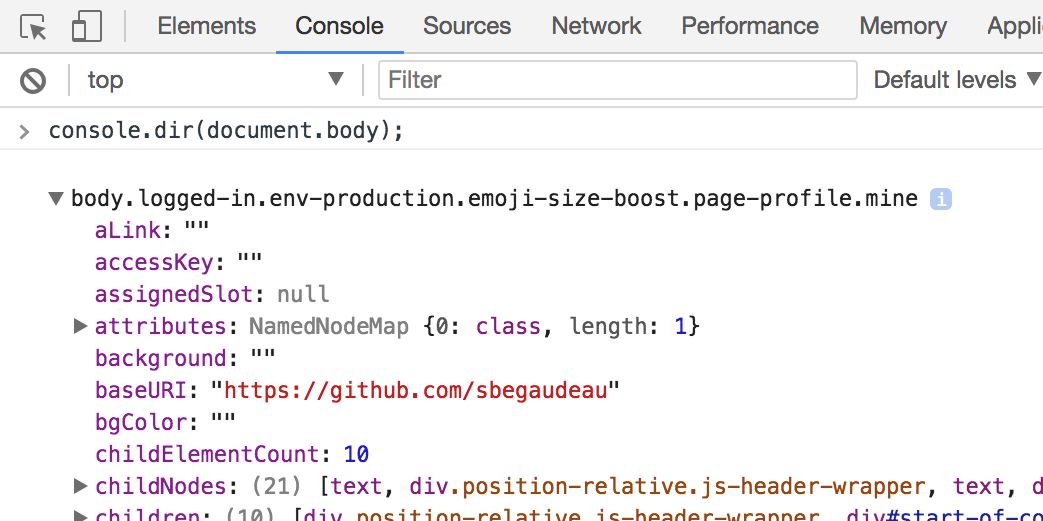
If you want to inspect the content of an XML or HTML element, console.dir(e) can be used to display the JavaScript properties of the DOM element representing it and console.dirxml(e) in order to see the tree-based structure of the DOM element with its children.
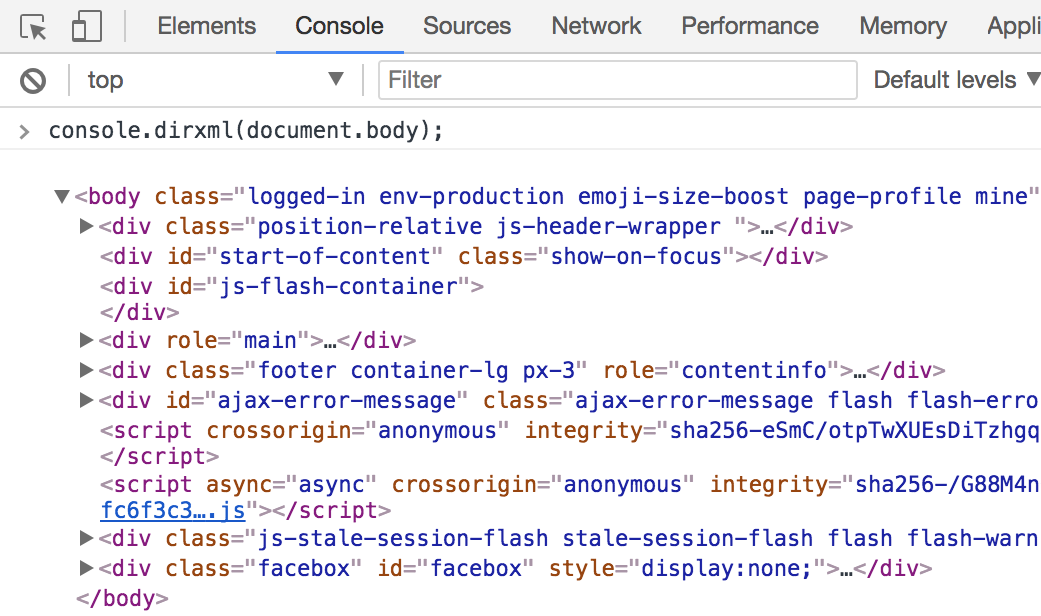
The behavior of console.log(e) is exactly the same as console.dirxml(e) for XML and HTML elements.
Command Line API
In order to write quickly powerful expressions in the Console, Chrome provides you with a powerful . To create an expression manipulating an element currently selected in the Elements tab, you can retrieve it by using the variable $0, for example, console.dirxml($0). The four previously selected elements can be retrieved with the variables $1, $2, $3 and $4.
In a similar fashion as JQuery, the first DOM element matching a given selector can be retrieved with $(selector). As such, the expression $('a') would return the first link in the current document. Use $$(selector) in order to retrieve all the DOM elements matching a specific selector. Using $$('tr:nth-child(odd)') would return all the odd rows of the tables in the document.
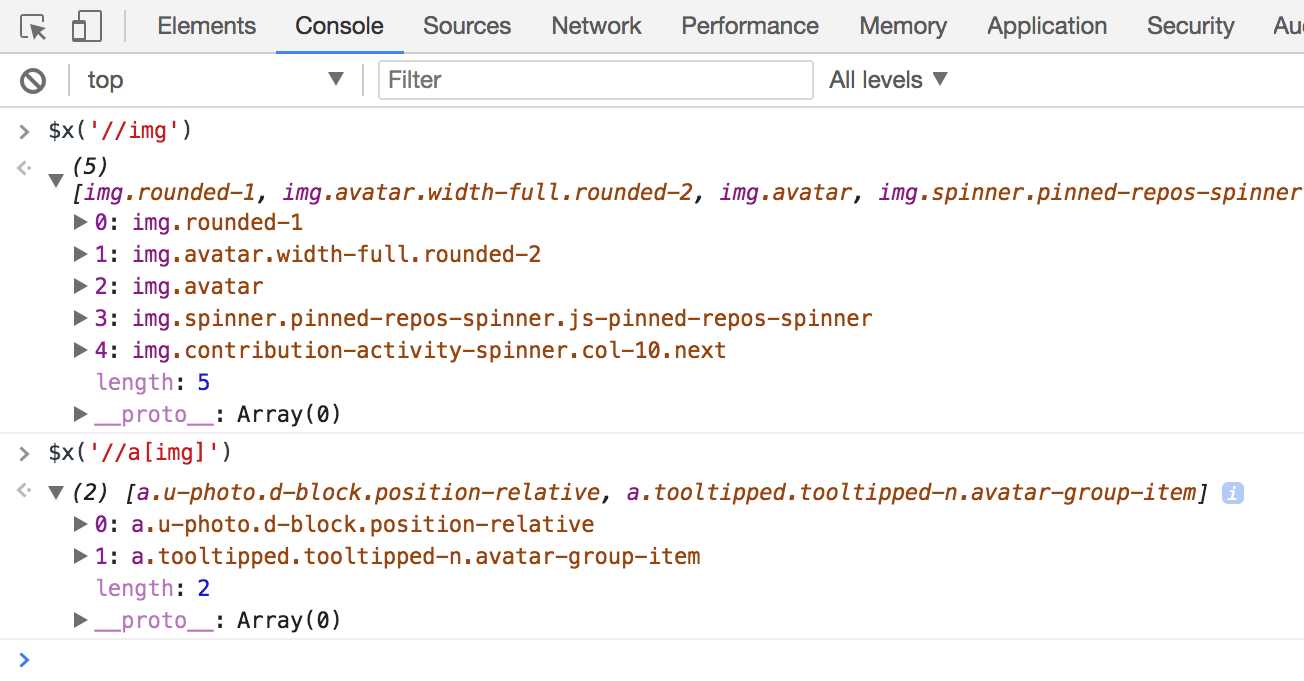
You can also retrieve elements using XPath expressions with $x(expression). You could get all the images of the document with $x('//img') or all the links with an image inside with $x('//a[img]').
If you need to write multiple expressions in the Console in order to debug something, use the variable $_ to manipulate the result of the previously evaluated expression.
The operation copy(object) allows you to copy a string representation of an object into your clipboard. If you want to add a breakpoint for a specific function, debug(f) let you tell the debugger to stop when this function will be evaluated. When you are done with this function you can unregister this breakpoint with undebug(f). To reveal a DOM element, an object or a function in the Chrome Devtools use the function ìnspect(o). If you try to inspect a DOM element, it will reveal it in the Elements panel, for example, inspect(document.body).
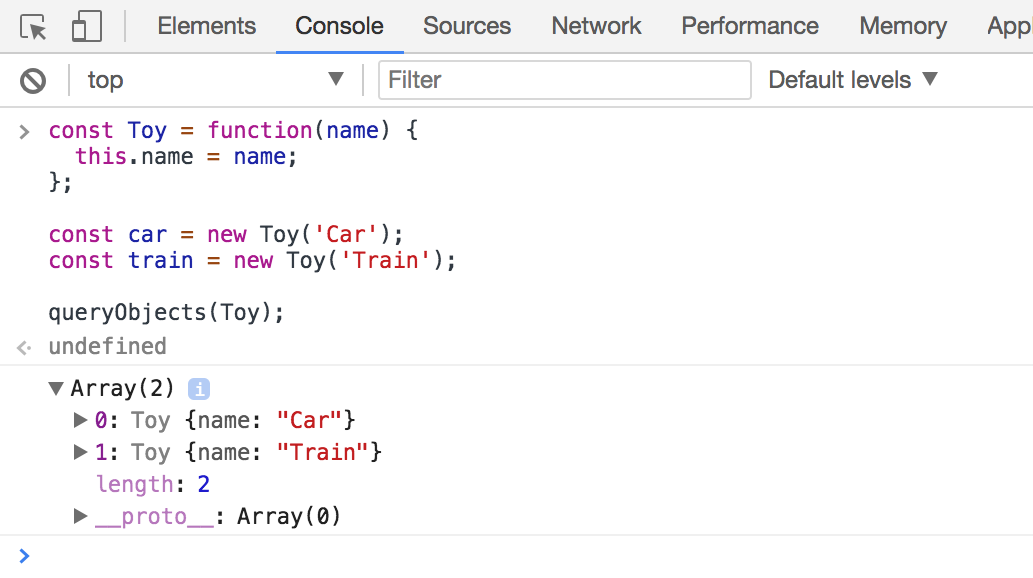
The function queryObjects(constructor) gives you the ability to retrieve all the instances created by a given constructor.
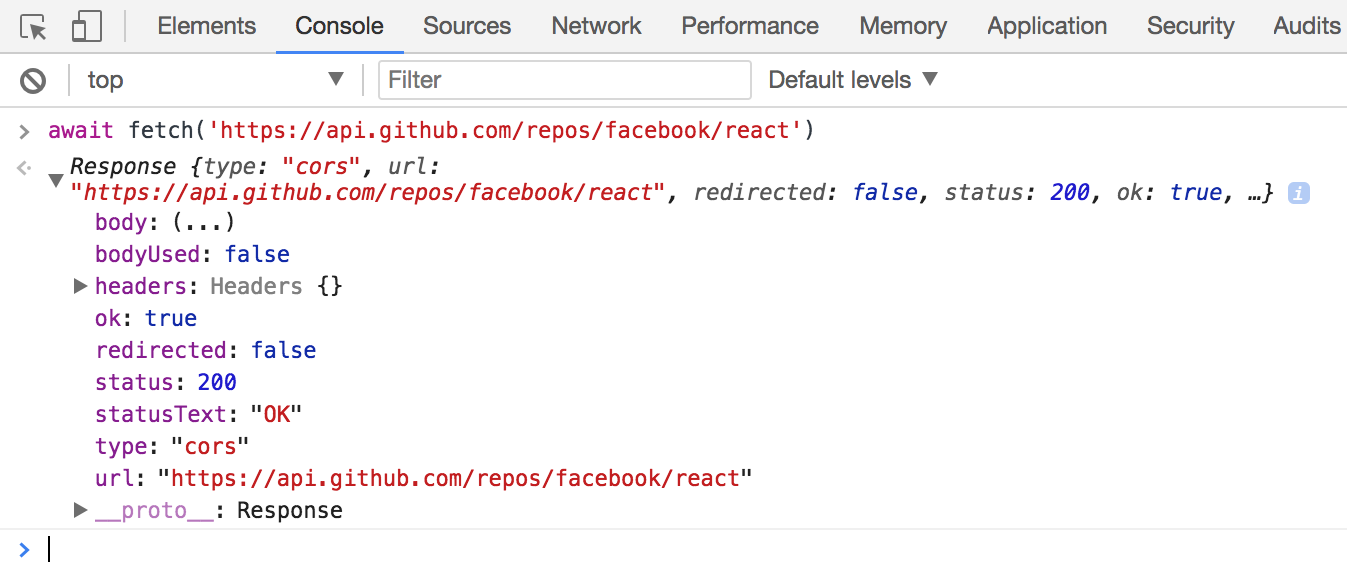
Finally, Chrome 62 brings support for the top-level await keyword in the Console. You can now leverage the power of the fetch API easily. For more information about the await keywords, have a look at the documentation.
For more information regarding web development or to be sure not to miss an update, follow me on twitter.