After having a look at the debugging of the DOM first and then all the secrets of the Console in the second part, in the third part of this analysis of the Chrome Devtools, we will detail the tooling provided by Chrome to view, edit and debug our code thanks to the Sources tab.
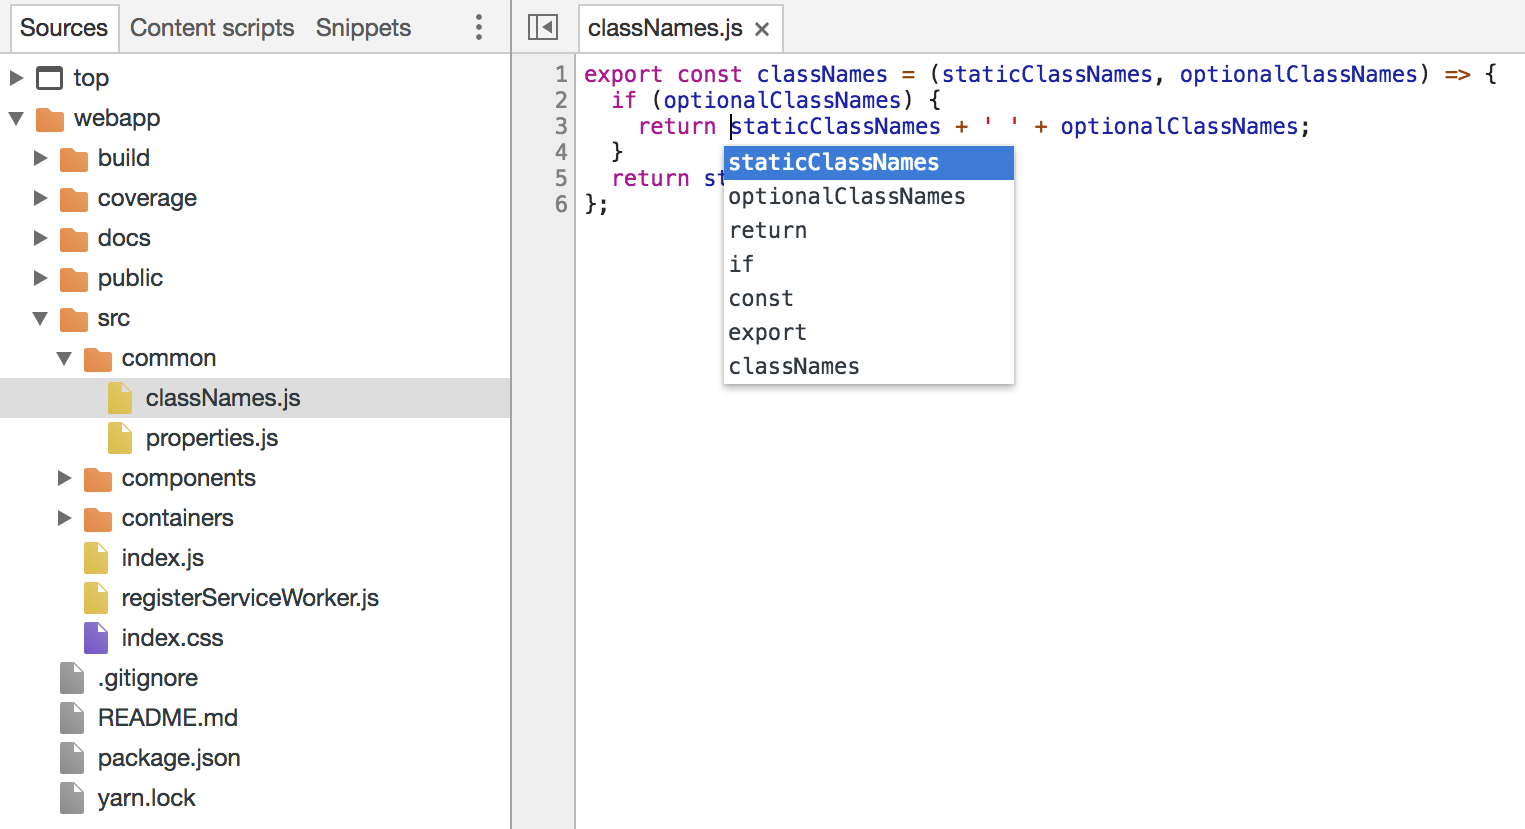
The Sources tab is divided into four different areas, on the left, the navigator is available with various drawers like Sources or Content Scripts, on the right, you have the debugger, in the center, you can find the editor and on the bottom, you have some drawers for the Console and additional tools.
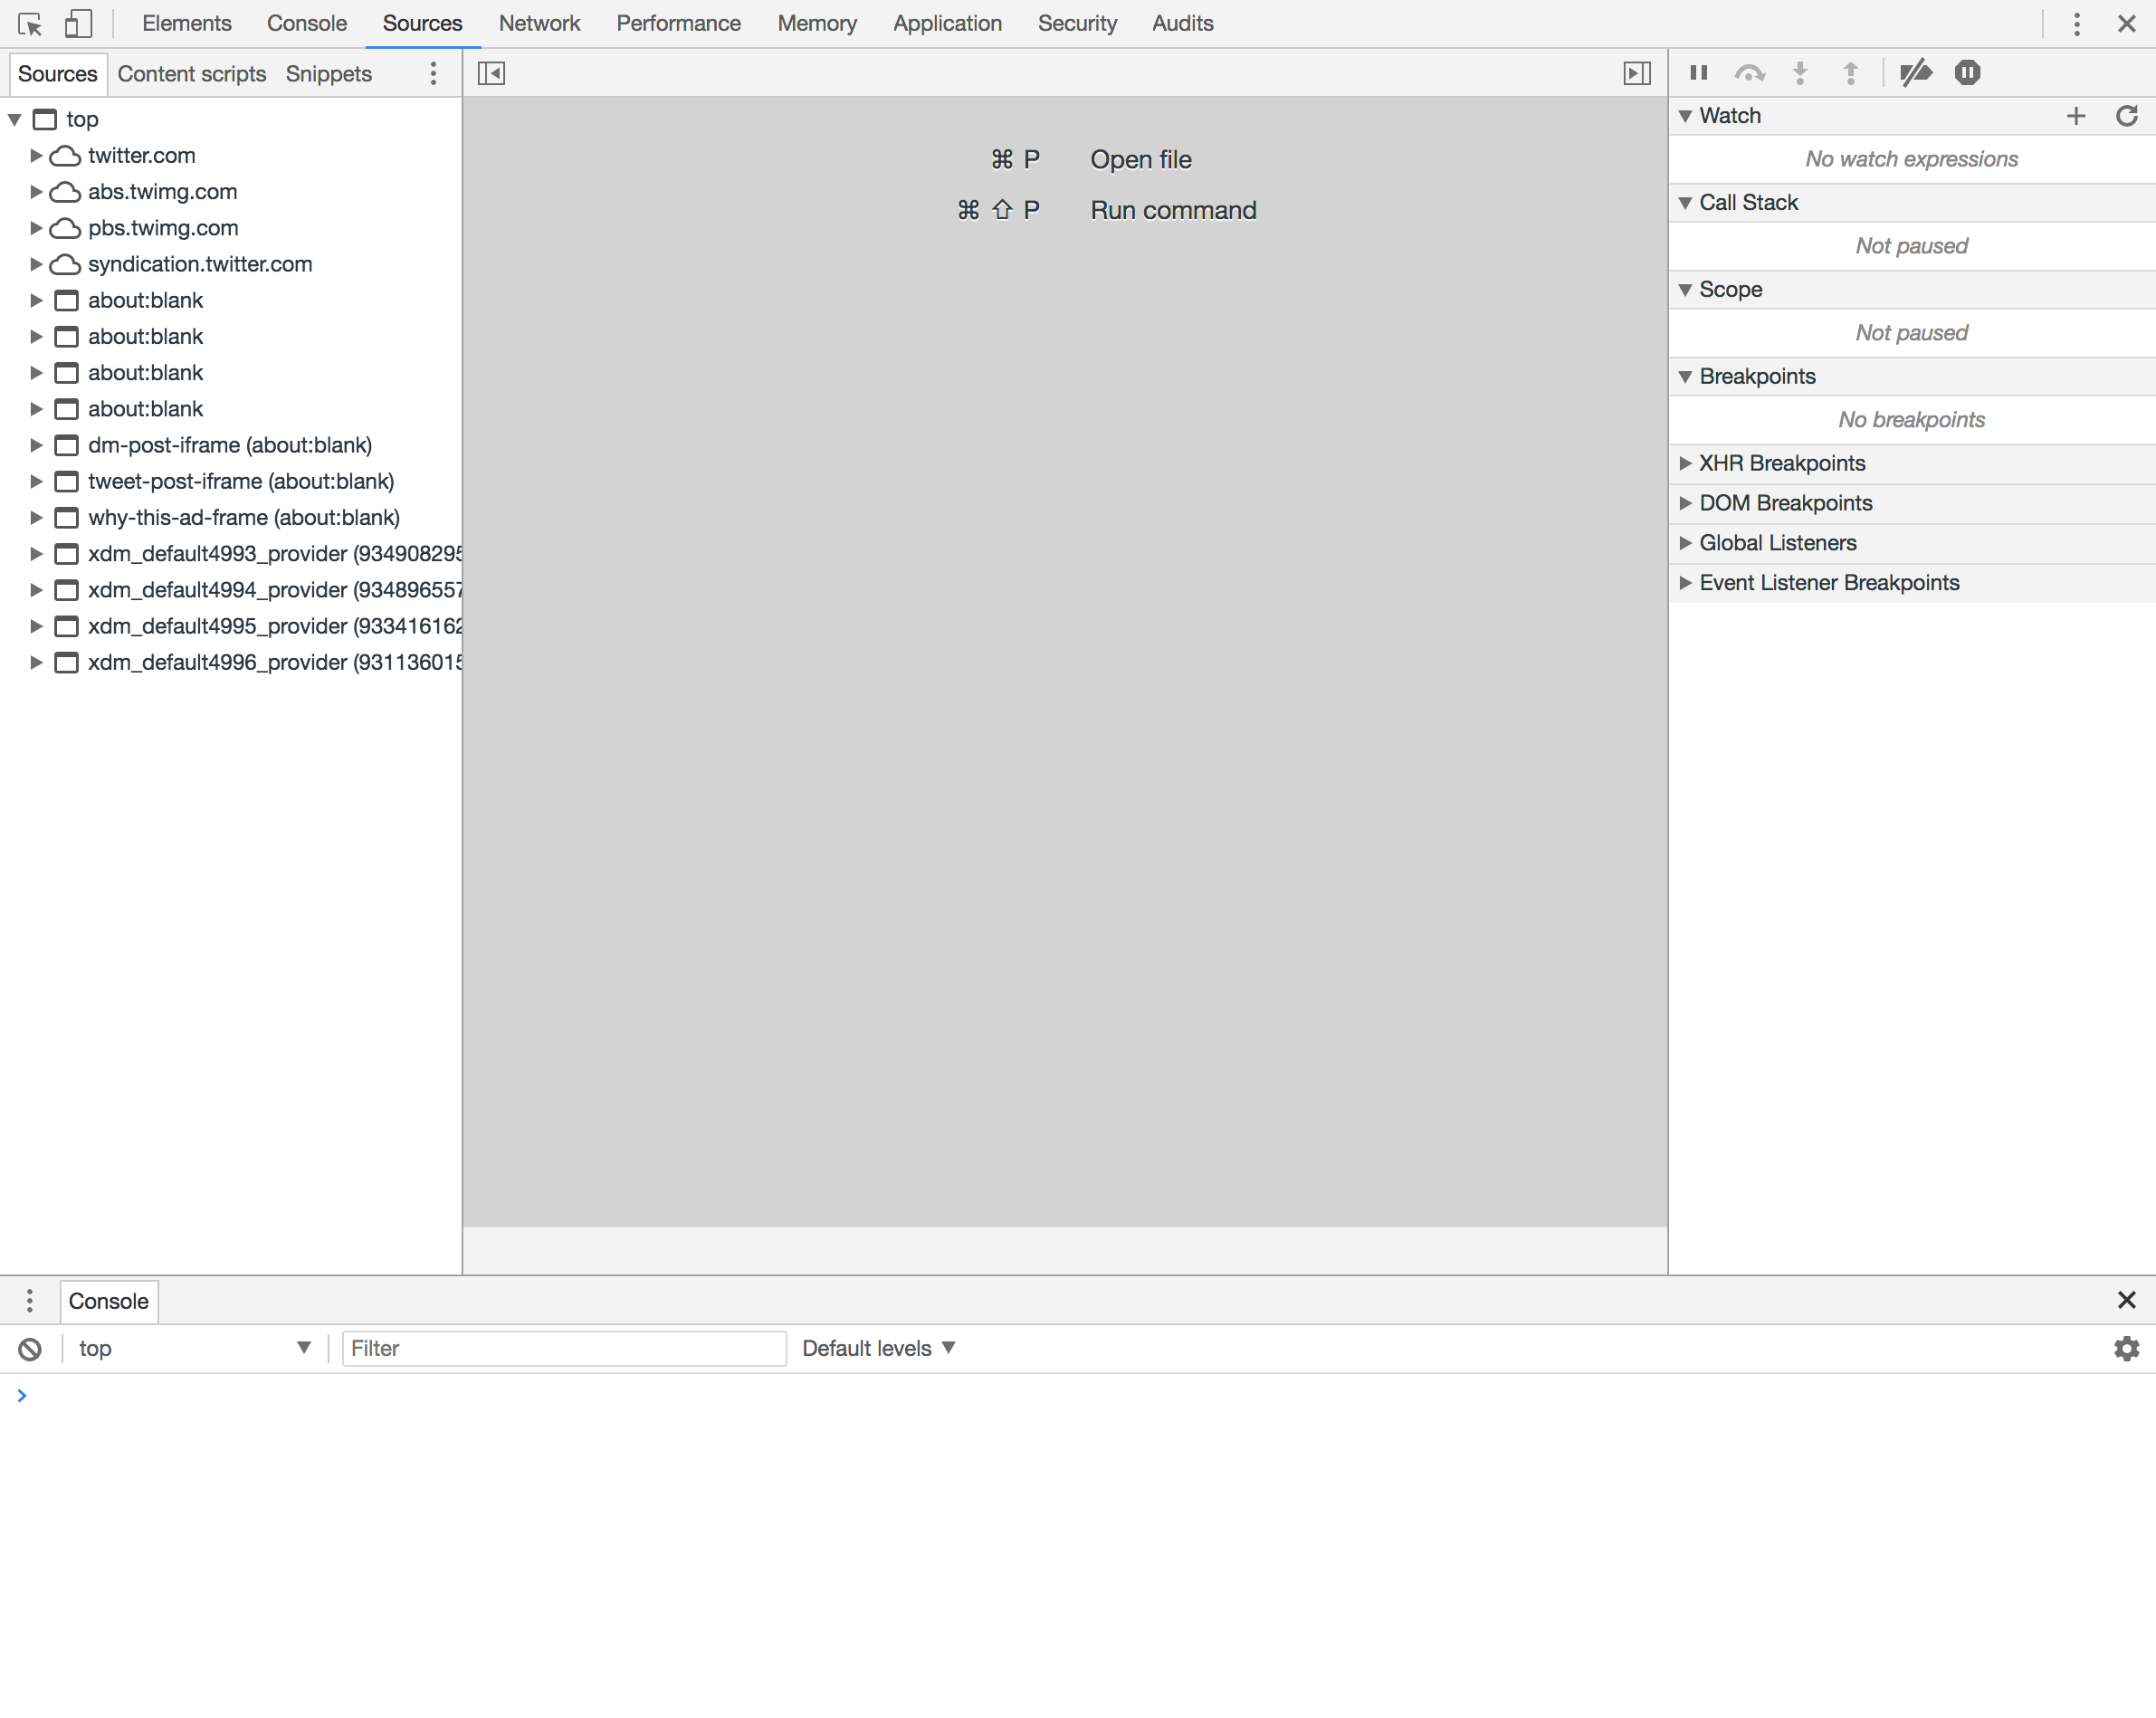
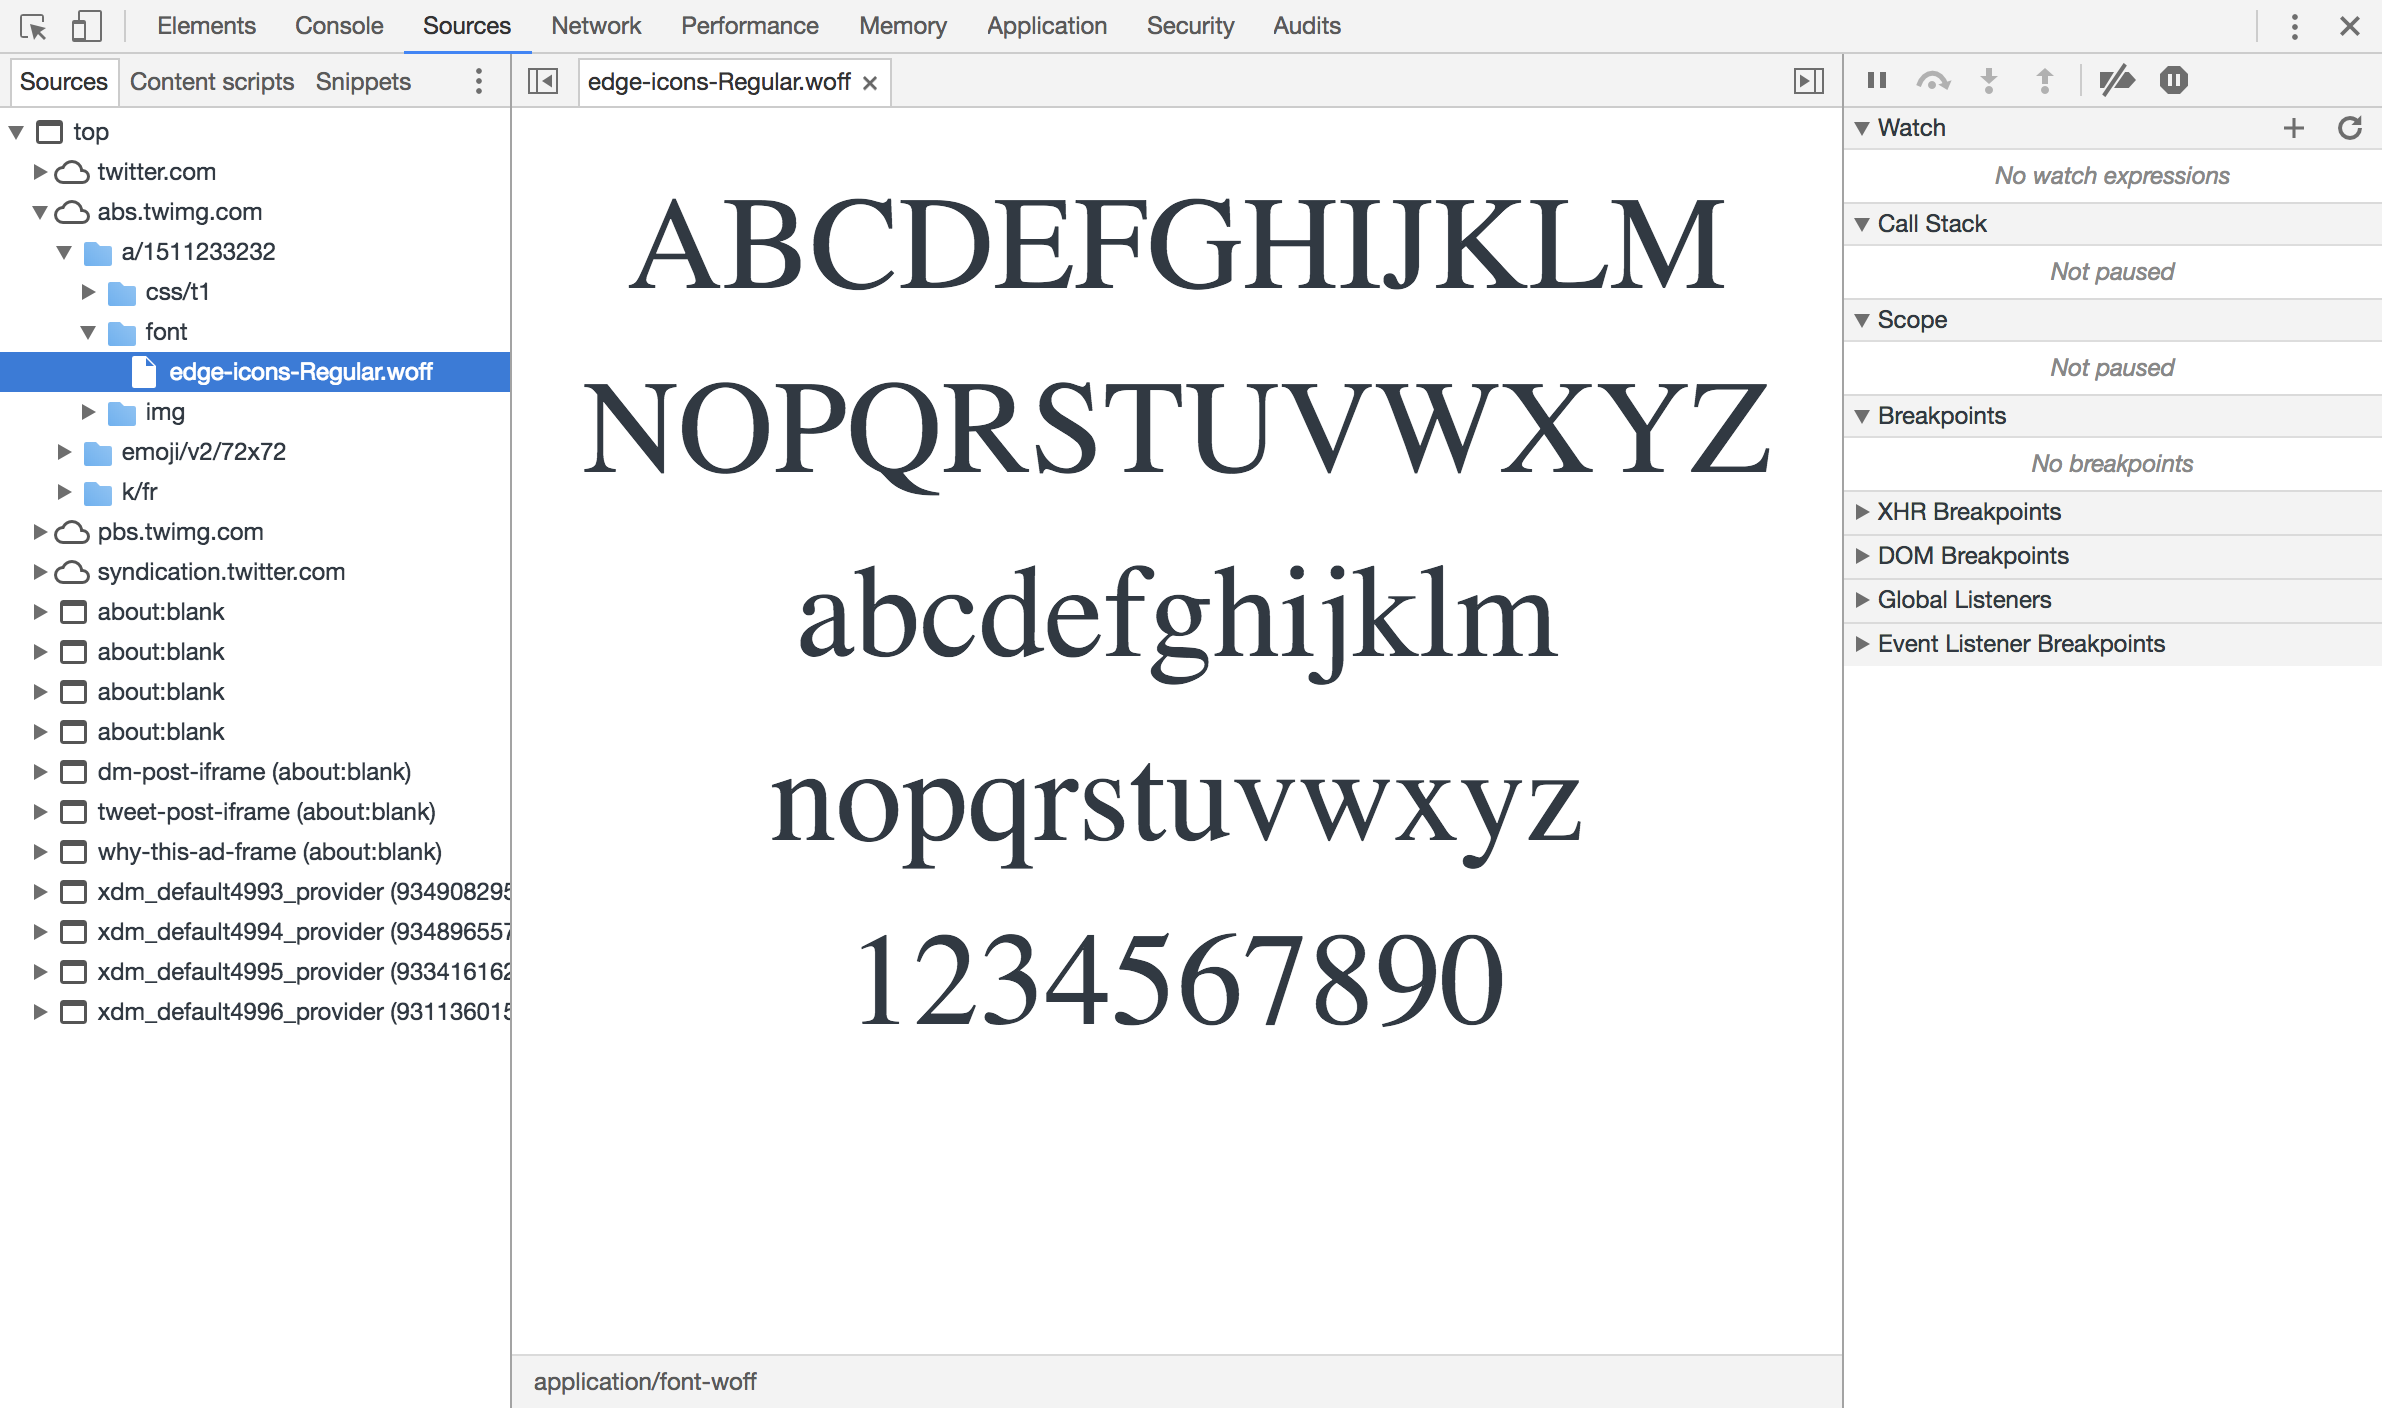
In the Sources drawer, inside of the navigator, all the resources loaded for the current page are visible. They are organized by domain. HTML pages will appear with a grey icon, CSS files with a purple one, JavaScript files with a yellow one and some resources like images or fonts will have a green icon. Click on any of those resources to have a look at their content. Chrome Devtools provide support to preview the most popular kind of resources like HTML, CSS, JavaScript files, images, and even fonts.
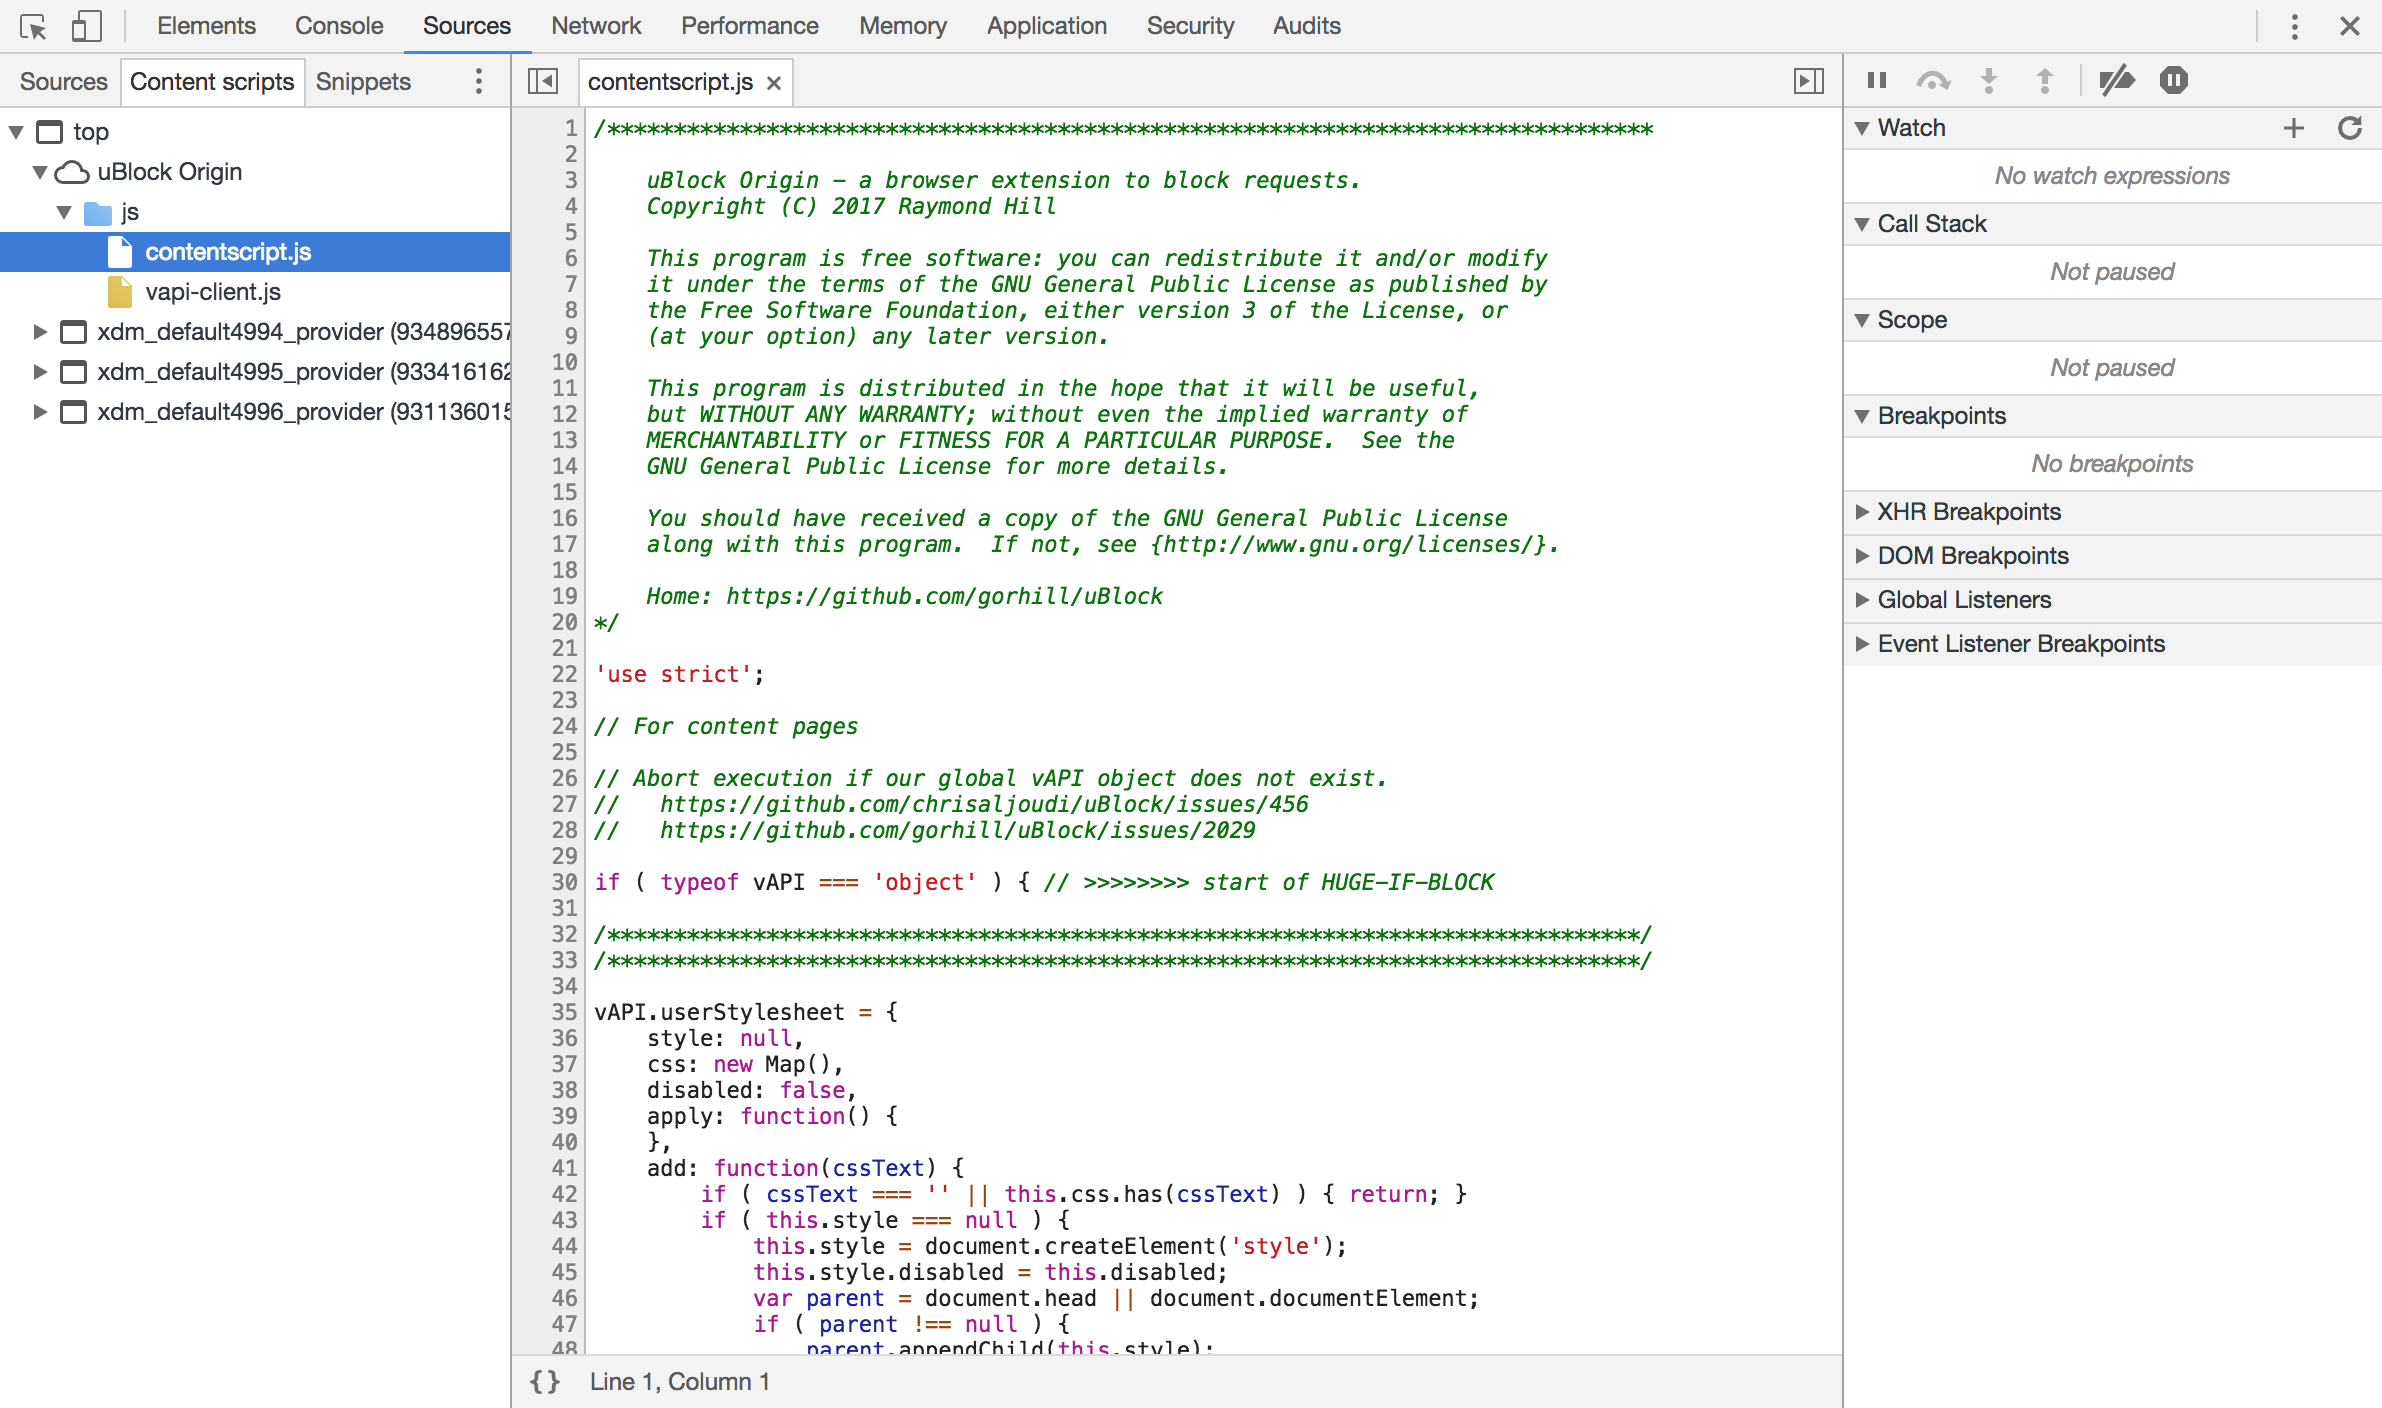
The Content Scripts drawer let you see the resources loaded by the extensions installed in Chrome. Debugging your application in a real environment means that you will have to consider some popular extensions installed by your end users like ad-blockers. Some of those extensions may modify heavily the behavior of your web application and the Content Scripts drawer lets you see their code and debug it if you encounter an issue. Here you have one of the scripts used by the uBlock origin extension.
The Snippets drawer contains some pieces of code that you may want to execute from time to time to help you debug your applications. To create a new snippet, you will have to provide a name and some JavaScript code. In order to run it, right-click on it and execute it. Your snippet will be executed in the context of the current page. The shortcut ⌘ + o (Mac) Ctrl + o (Win/Linux) lets you execute a command or open any resource quickly. It is possible to execute a snippet without having to right-click on it by starting your request with !. This way a snippet named allcolors can be executed by typing !allcolors. You can find collections of snippets online to speed up your development process.
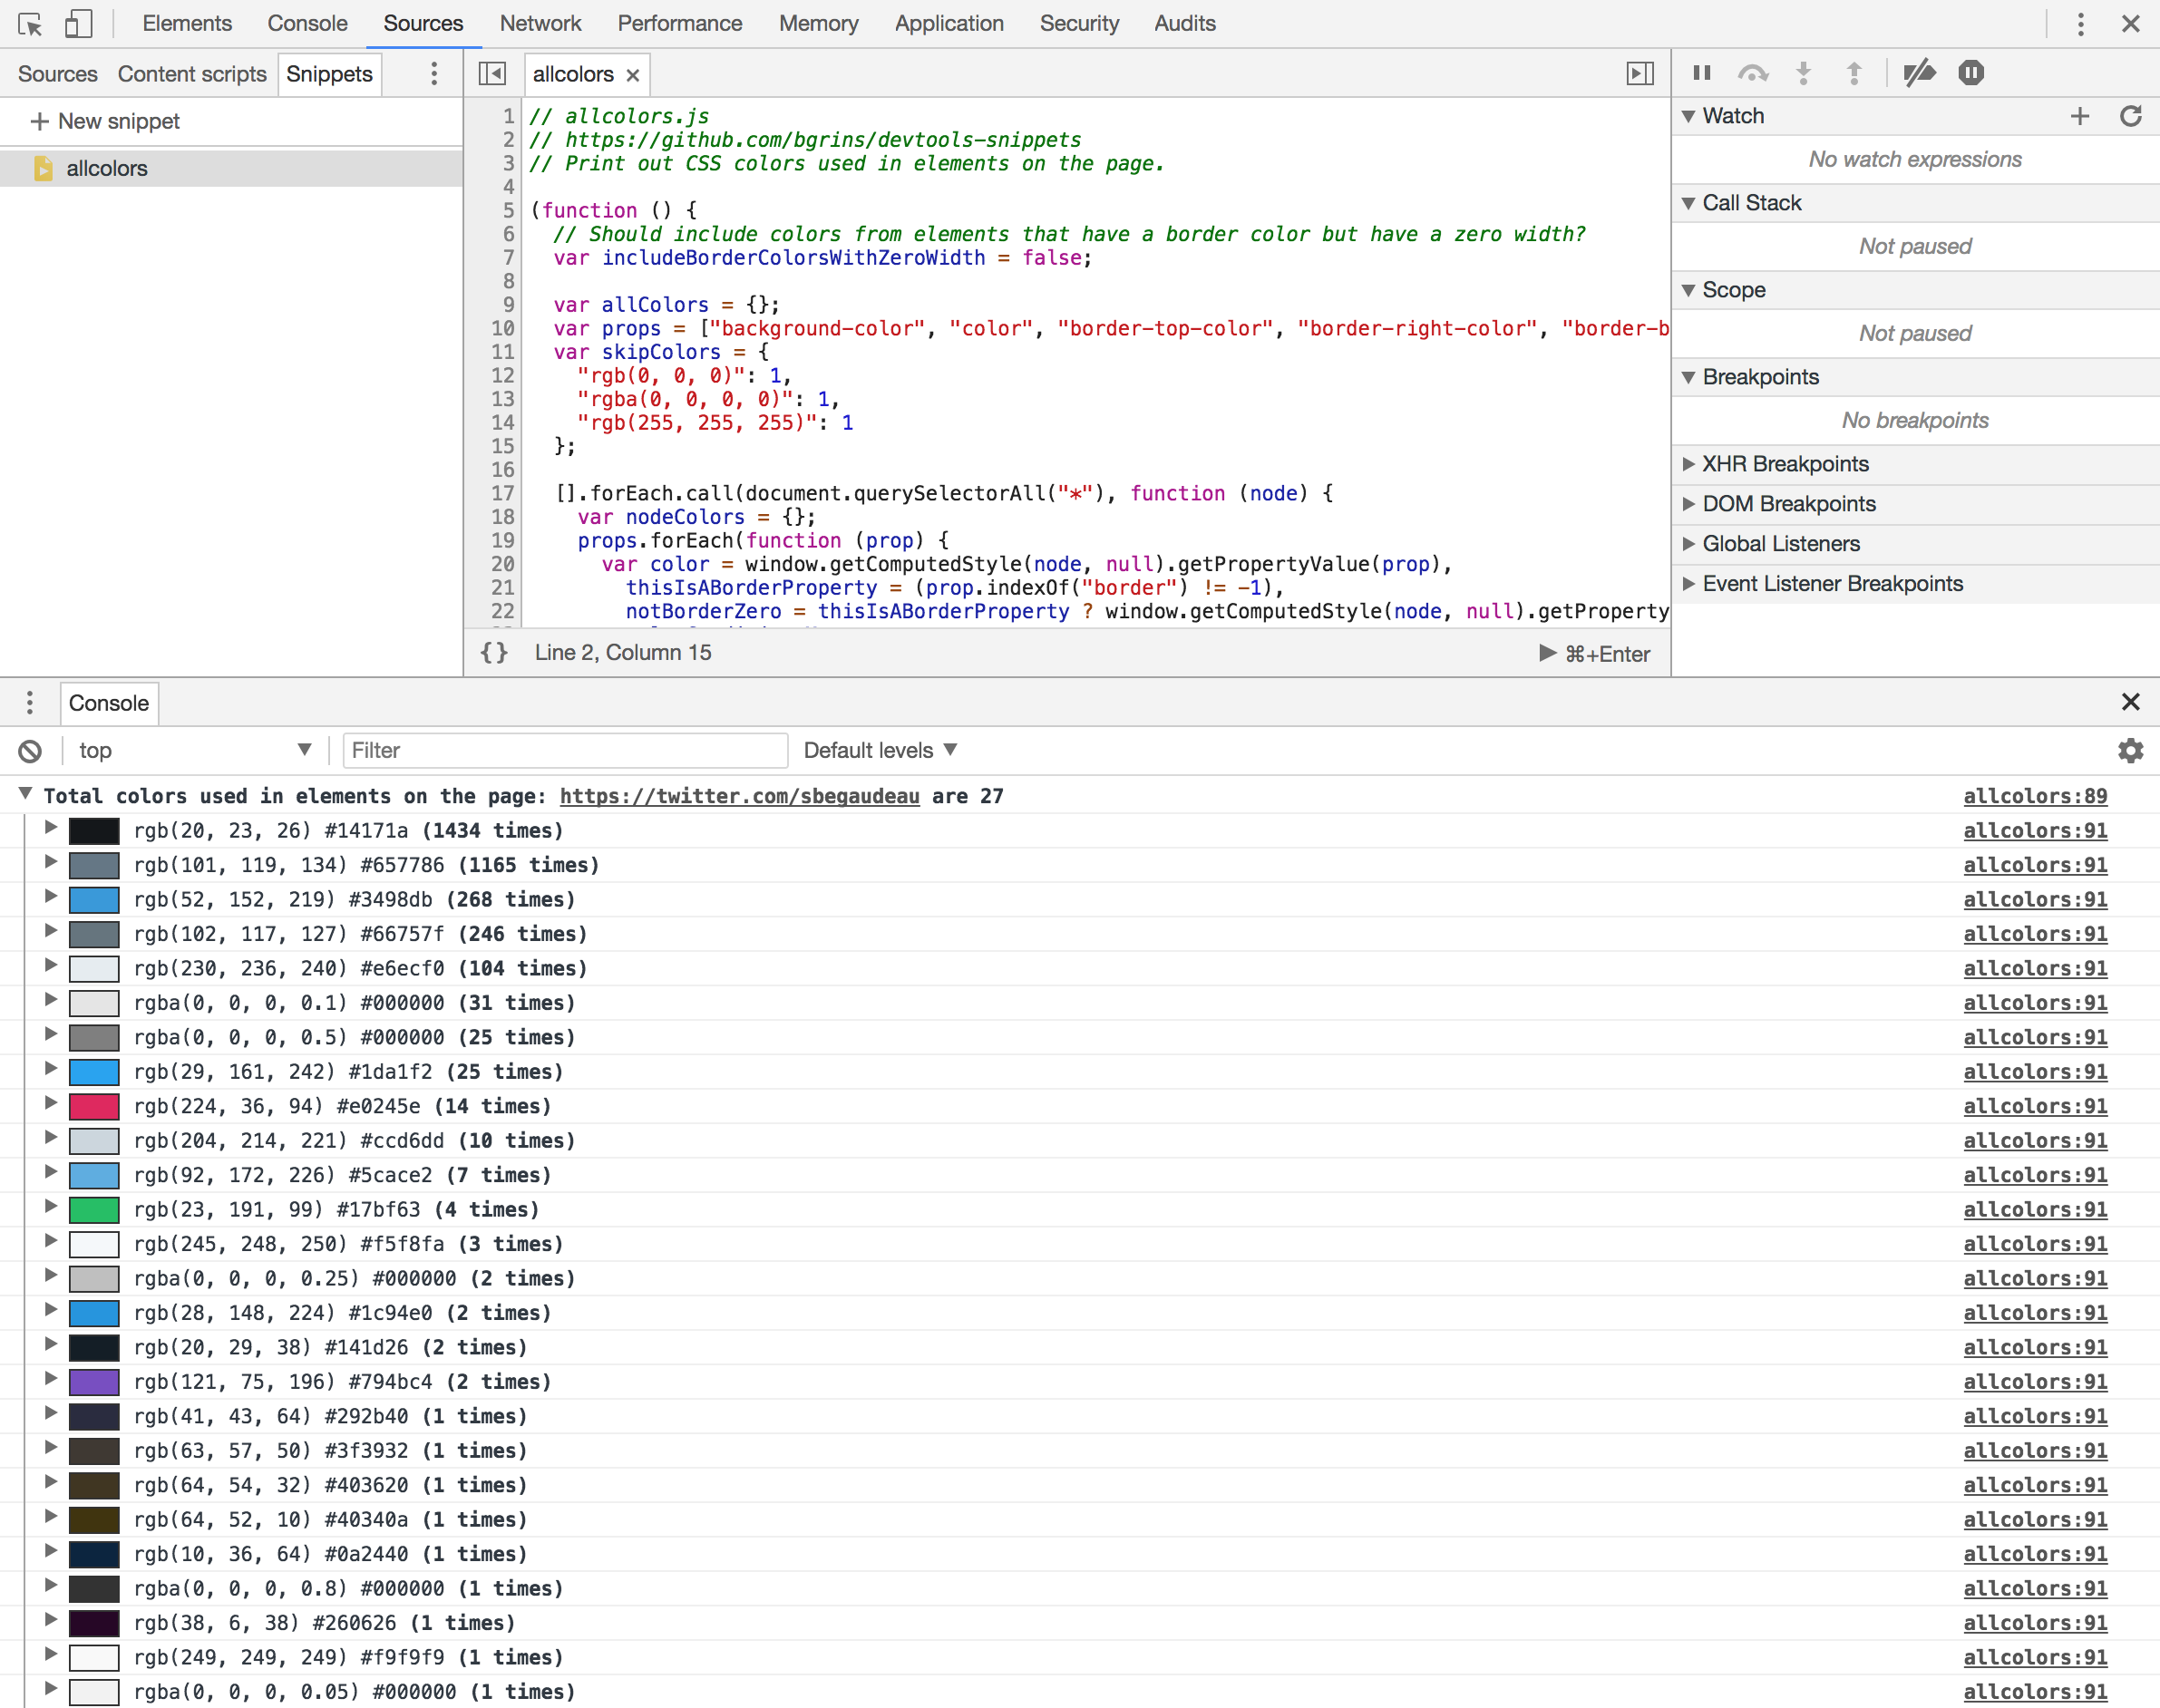
If you want to write your own snippets, don’t forget to leverage all the amazing features of the Chrome Devtools Console API to create tables or groups for example. In the example above, the result of the code snippet uses a table to show all the colors used on my page.
In the center of the Sources tab, you will find see the editor area where you can view and even edit some resources. On the top left and top right corners of the editor, you have some actions to show or hide the navigator panel or the debugger if you want to give more room to the editors. Editors can be opened to manipulate both local or remote resources.

Chrome Devtools provide syntax highlighting for CSS, HTML and JavaScript files. When a file is opened in the editor, it will try to detect if source maps are available. If source maps have been detected, the editor will load them directly showing you a version of the code that should be easier to read and debug. It is also possible to add source maps to a minified file directly in the editor using the contextual menu.
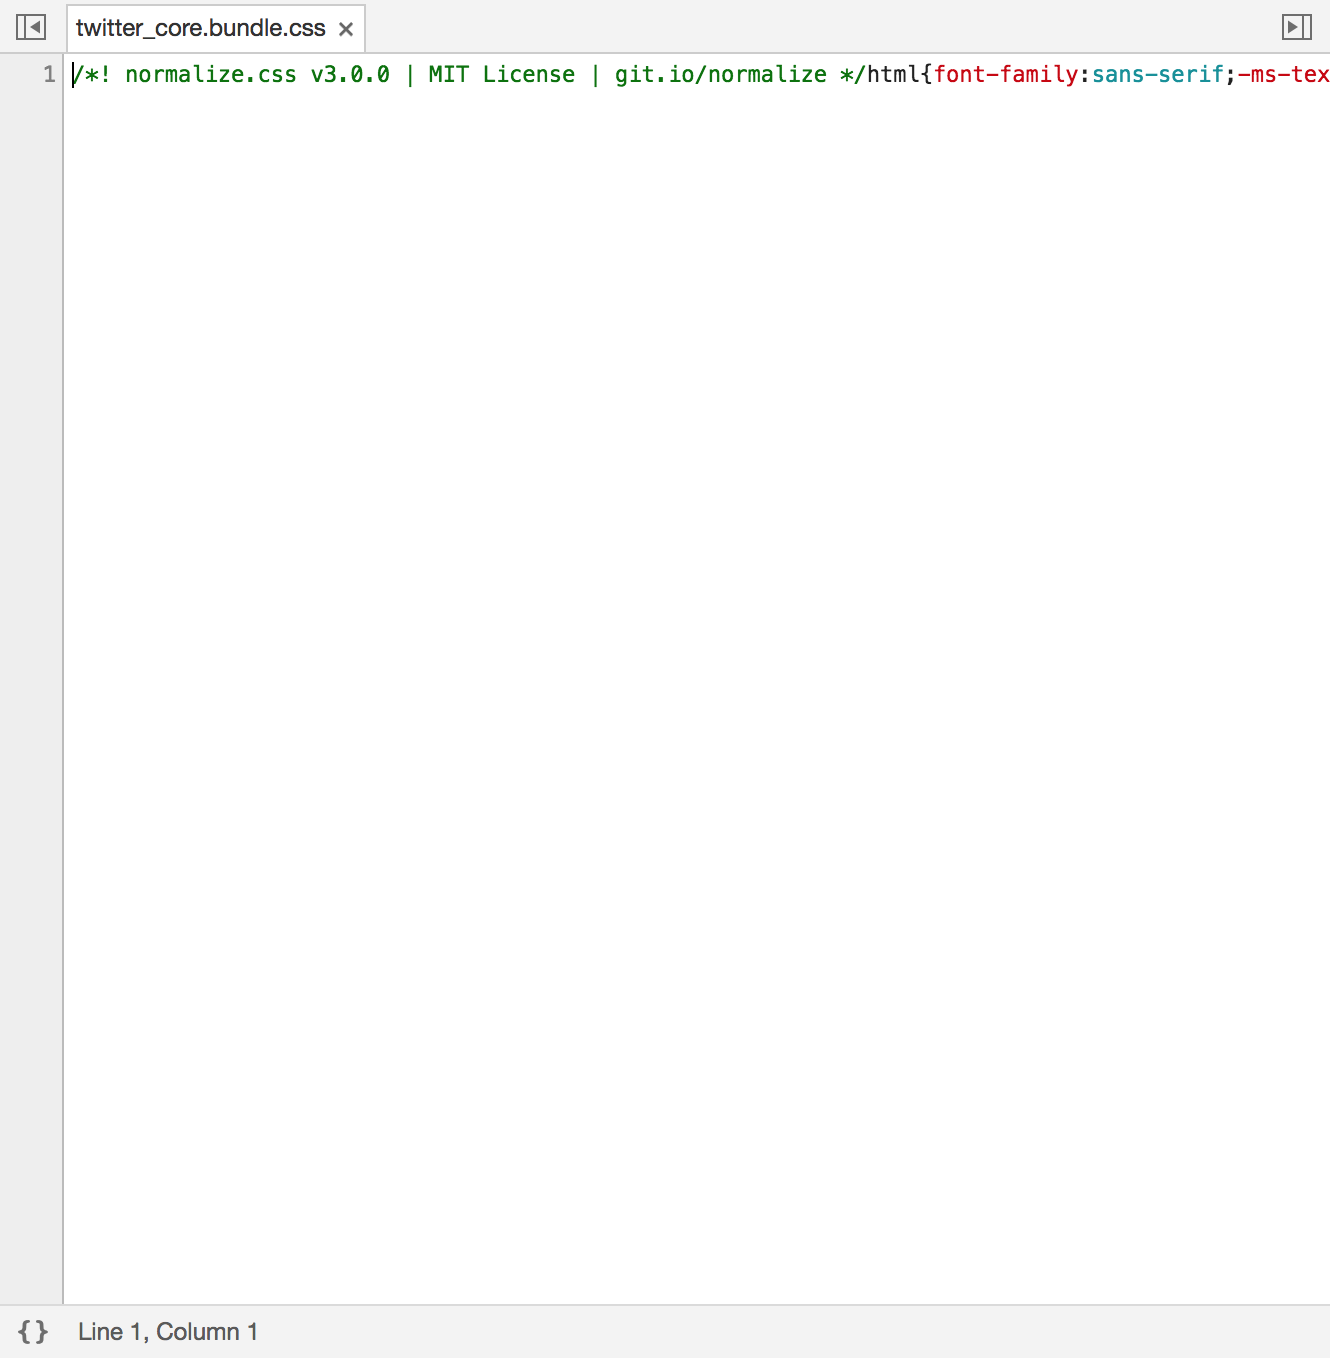
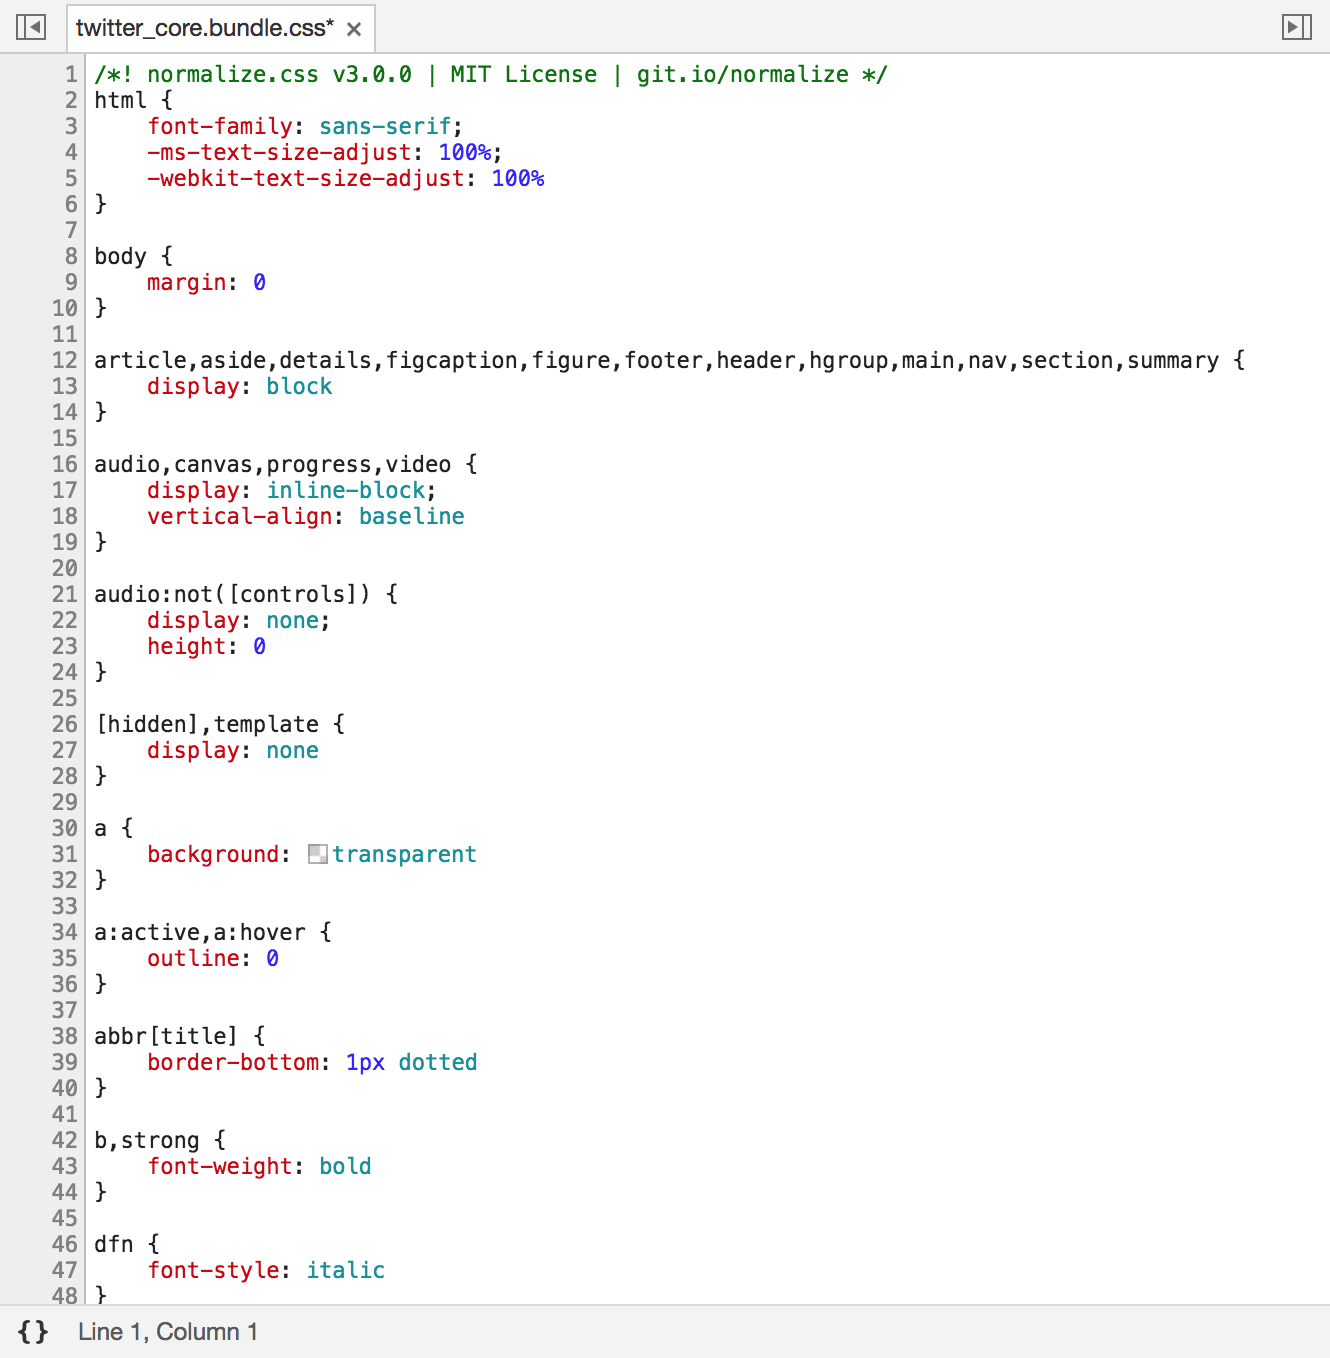
If you need to manipulate minified resources without source maps, the JavaScript, HTML and CSS editors can pretty print the content of the resource thanks to the {} action at the bottom of the editor.
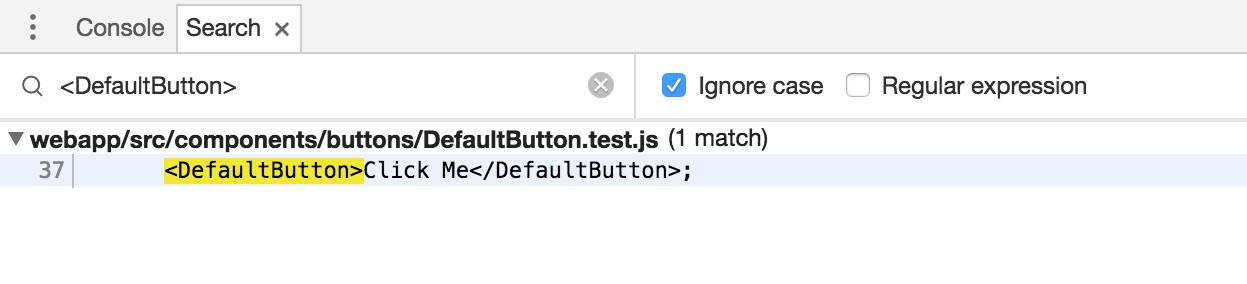
The editor gives you the ability to evaluate quickly some pieces of JavaScript in the console thanks to its contextual menu. You can open the search bar thanks to ⌘ + f (Mac) Ctrl + f (Win/Linux). It allows you to select if you want to search in a case-sensitive manner or even with a regular expression. It is also possible to replace the result from the search bar.

To find some content across all resources in the workspace, use the Search drawer that you can open next to the Console.
If you want to manipulate local resources in Chrome Devtools, add them to your workspace by right-clicking in the Sources drawer of the navigator panel. By opening local resources instead of remote resources, the editors will allow you to edit your files directly from Chrome.
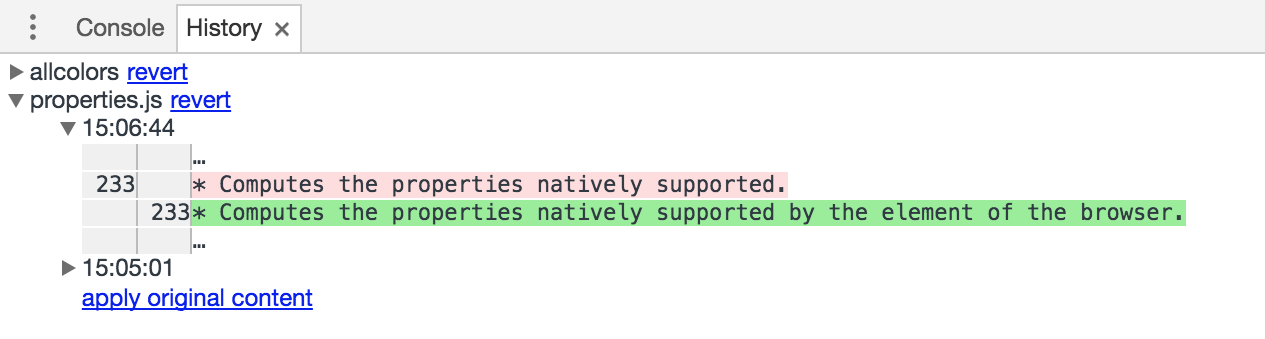
The history of the changes you’ve made is visible in the History drawer on the bottom of the Chrome Devtools.
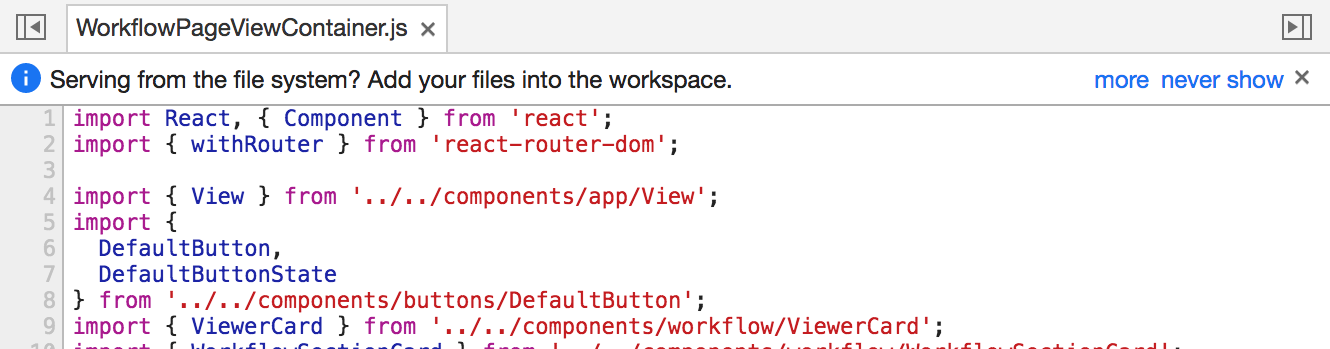
Chrome can detect that your remote resources may be in fact coming from your file system and it can easily let you add your local resources to the workspaces instead of manipulating remote ones.
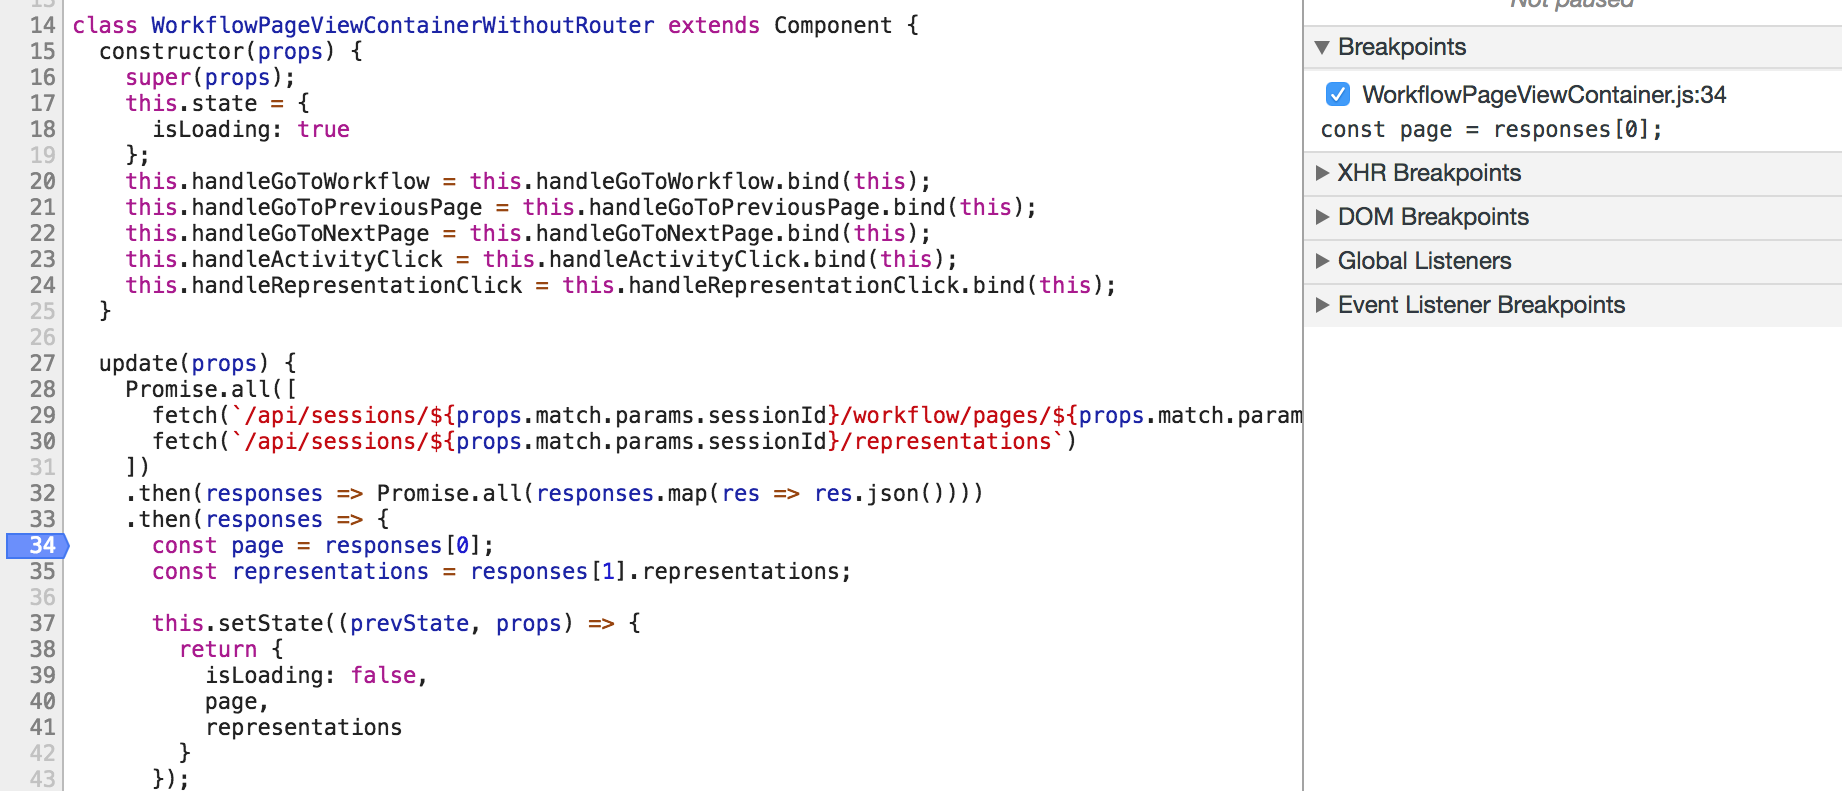
The left panel of the Sources tab contains the debugger. In order to add a breakpoint to a file, click on the line number of a specific line. It will place a marker on the line number and a new breakpoint will be visible in the debugger. You can remove it easily by clicking on the marker or deactivate it by unchecking it in the list of breakpoints. The contextual menu of the breakpoint lets you deactivate all breakpoints, remove all breakpoints and even remove all breakpoints except the selected one.
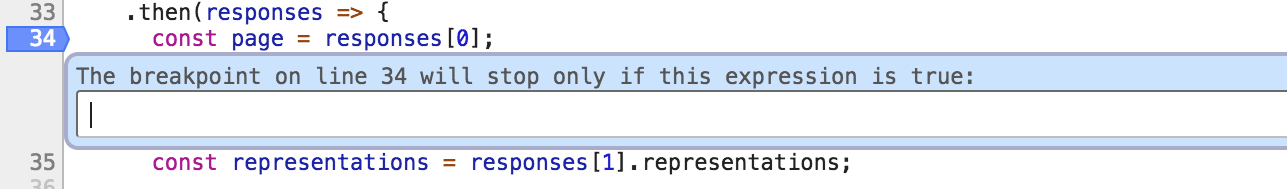
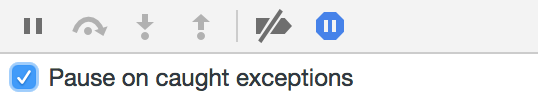
The debugger statement lets you stop the execution of your code programmatically. As we have seen it in the second part of our overview of Chrome Devtools, you can also use debug(func) and undebug(func) in order to tell Chrome to stop when a specific function is invoked. To create a conditional breakpoint, right-click on the marker of an existing breakpoint and select Edit breakpoint to specify a condition to fulfil to trigger this breakpoint. Once stopped at a breakpoint, you can, of course, step over, into or out of the next function call. The debugger can also be stopped on any exceptions, even caught ones.
If you don’t want to consider a script during the debugging session, Chrome can treat it as a black box. It will be ignored by the debugger even if it throws exceptions while you have asked to stop the program on any exceptions.

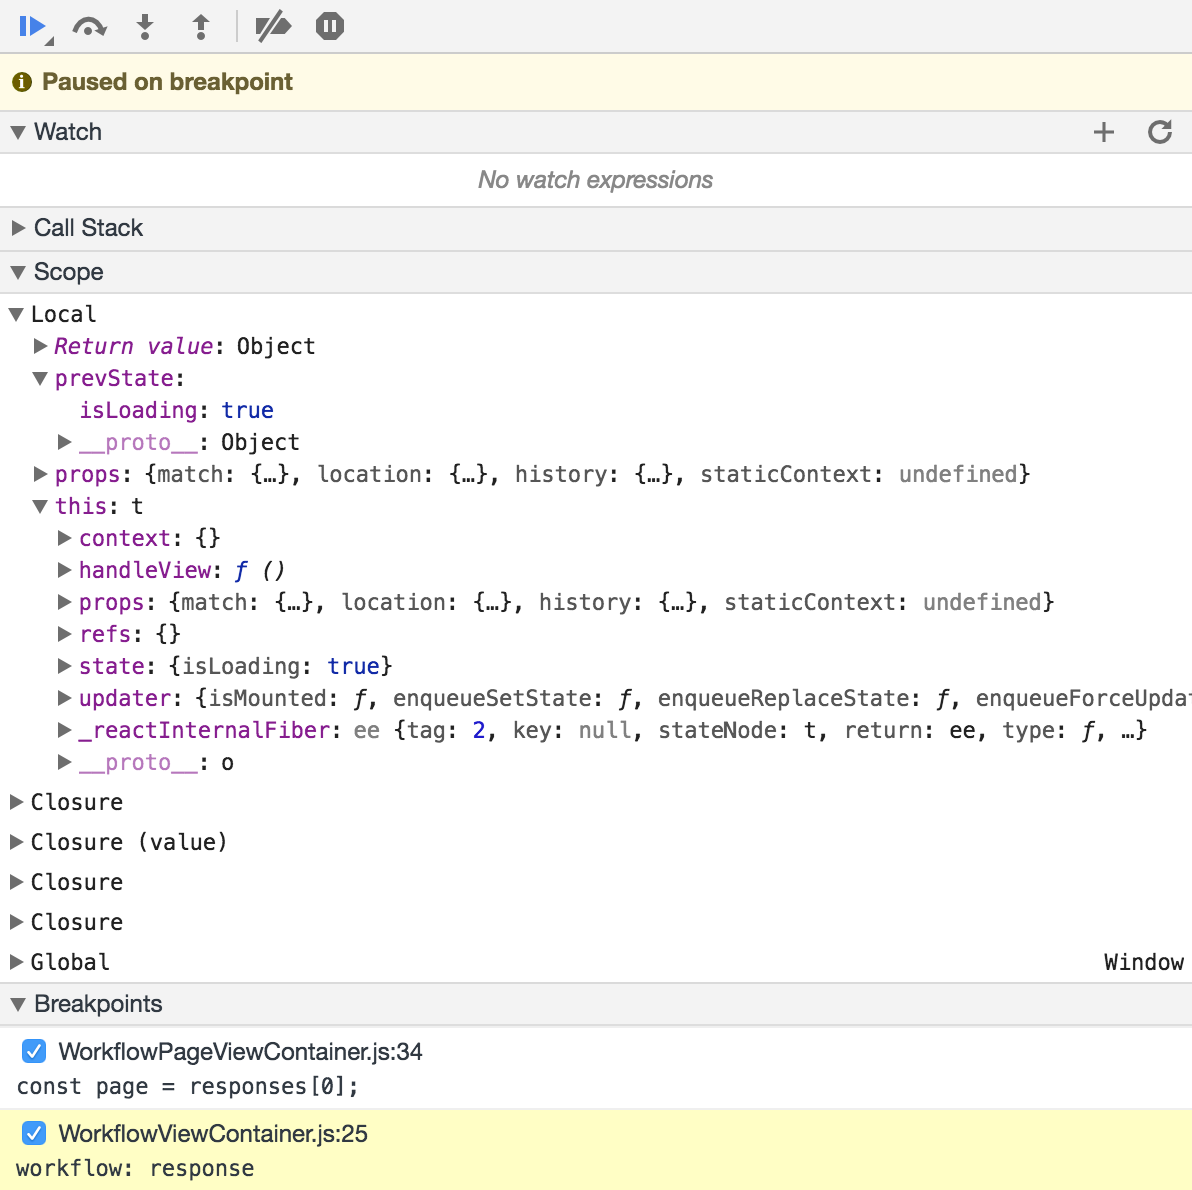
You will be able to see the precise call stack of the current instruction along with the state of all the JavaScript scopes up to the Global scope.
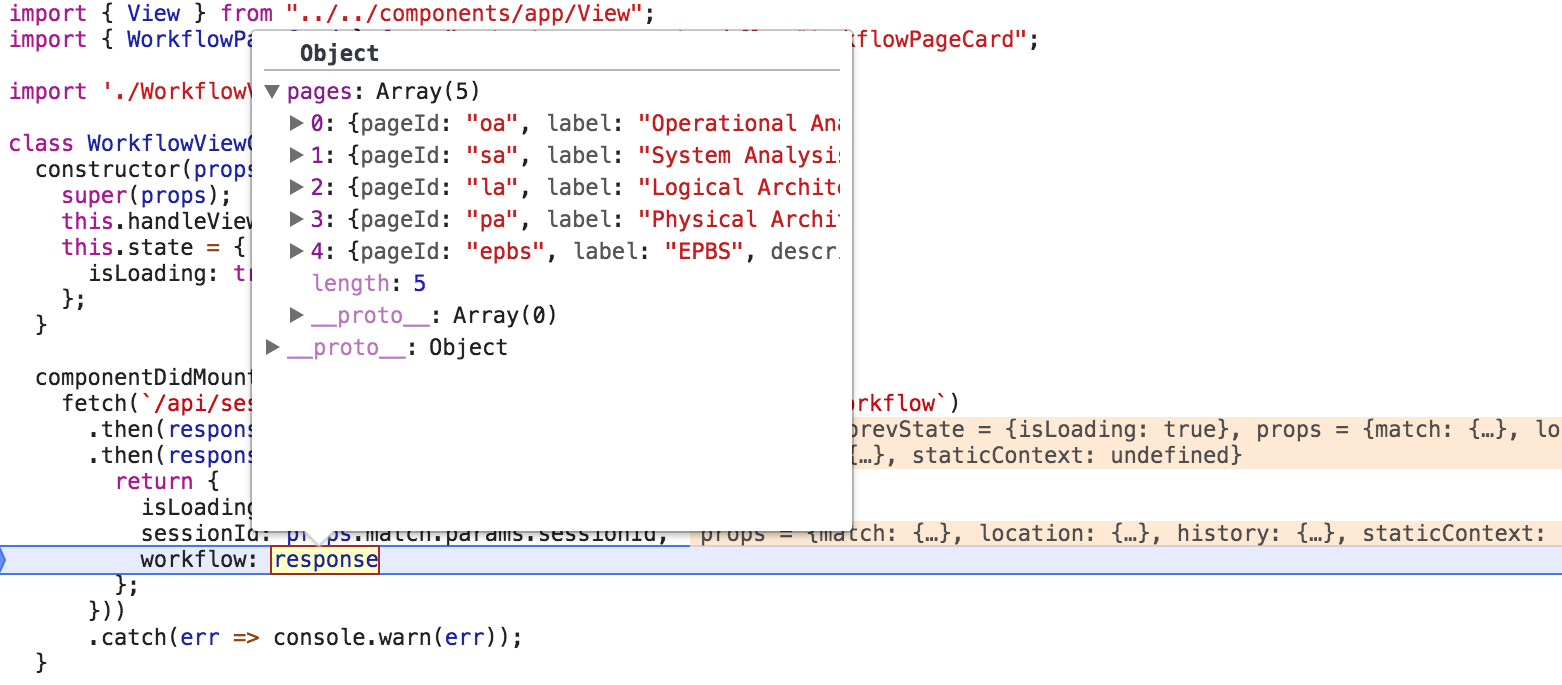
For each instruction in your local scope, you will see the result of the expression directly at the end of the line. This will let you know more easily the state of the code surrounding your breakpoint. Hover over a piece of code to see its value. For complex values like objects, a popup will be available to let you navigate inside of the current value. You can also execute code inside the console using the local scope of the breakpoint.
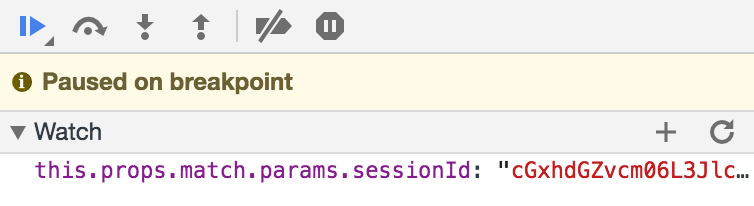
In order to easily debug large pieces of code, you can add expressions to be watched by the debugger. It is possible to type them manually or to select an expression in the editor to add it to the watched expressions.
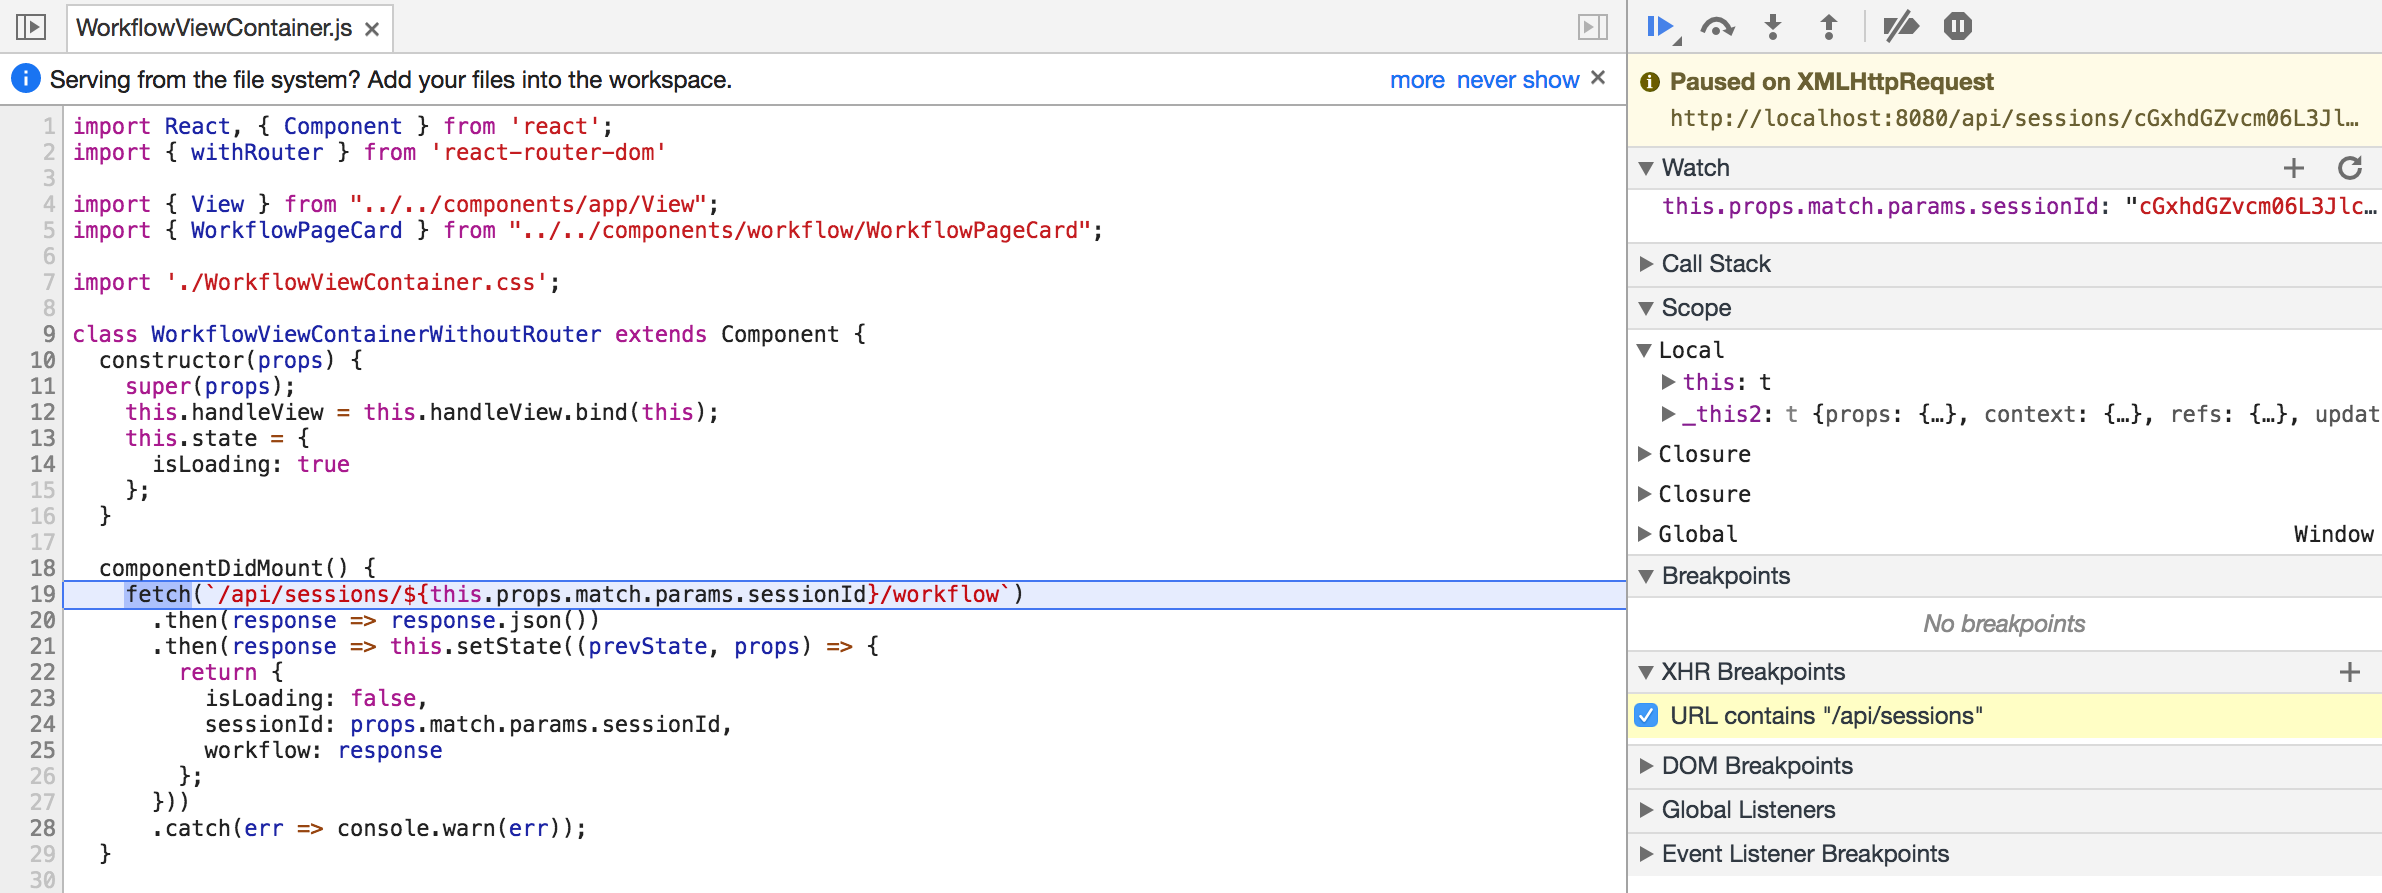
To debug interactions with your server, you can create breakpoints for your XMLHttpRequests. You just need to indicate a part of the URL for Chrome to stop. Once paused, Chrome will indicate that it has paused specifically on an XMLHttpRequest and it will specify the URL of the request. This kind of breakpoints also works with the fetch API of course.
In a similar fashion, you can add breakpoints on some modifications of the DOM from the Elements tab. To analyze the listeners of your application, you will find the list of the global listeners along with a reference to the code used to register them. Finally, Chrome Devtools offer you the ability to add breakpoints for specific events like click, resize, focus in, scroll, etc.
For more information regarding web development or to be sure not to miss an update, follow me on twitter.