Chrome Devtools - Part 5

In this post, we will see how to detect issues with the user experience of your web application with the Performance and Memory tabs in the Chrome Devtools. Chrome contains a complete web application profiler in its Performance and Memory tabs. With the Performance tab, it is possible to record everything happening in your web application. You have the ability to start a new recording with ⌘ + e (...

Modeling tools go up to the cloud

At Obeo , we have done the first steps to bring Sirius to the web. Today we are ready to work with you to bring your own modeling tool up to the cloud. If you are curious about details, this is the longer story… As you know, at Obeo, we have been working on modeling tools for a long time now, and we therefore have a lot of experience developing graphical tools. Obeo is a key player in the Modeling...

Chrome Devtools - Part 4

After our tour of the Chrome Devtools Console, we can now have a look at the Network tab. This tab will display all communication between the current page and any server. The Network tab is composed of two parts, on top you will find an overview of the timeline where all the requests that have been made can be seen. Below this overview, the Network tab shows the details of each request. Finally ab...

CheConf18

A small post to announce that I will be speaking at CheConf18 , a one day conference dedicated to Eclipse Che an extensible cloud development platform. I am really excited to participate to this event! I will co speak with Stevan Le Meur, Che maintainer from RedHat about Building Extensibility and Community for Che. During our session, you’ll get a preview of the work we prototyped at Obeo to brin...

Chrome Devtools - Part 3

After having a look at the debugging of the DOM first and then all the secrets of the Console in the second part, in the third part of this analysis of the Chrome Devtools, we will detail the tooling provided by Chrome to view, edit and debug our code thanks to the Sources tab. The Sources tab is divided into four different areas, on the left, the navigator is available with various drawers like S...

Chrome Devtools - Part 2

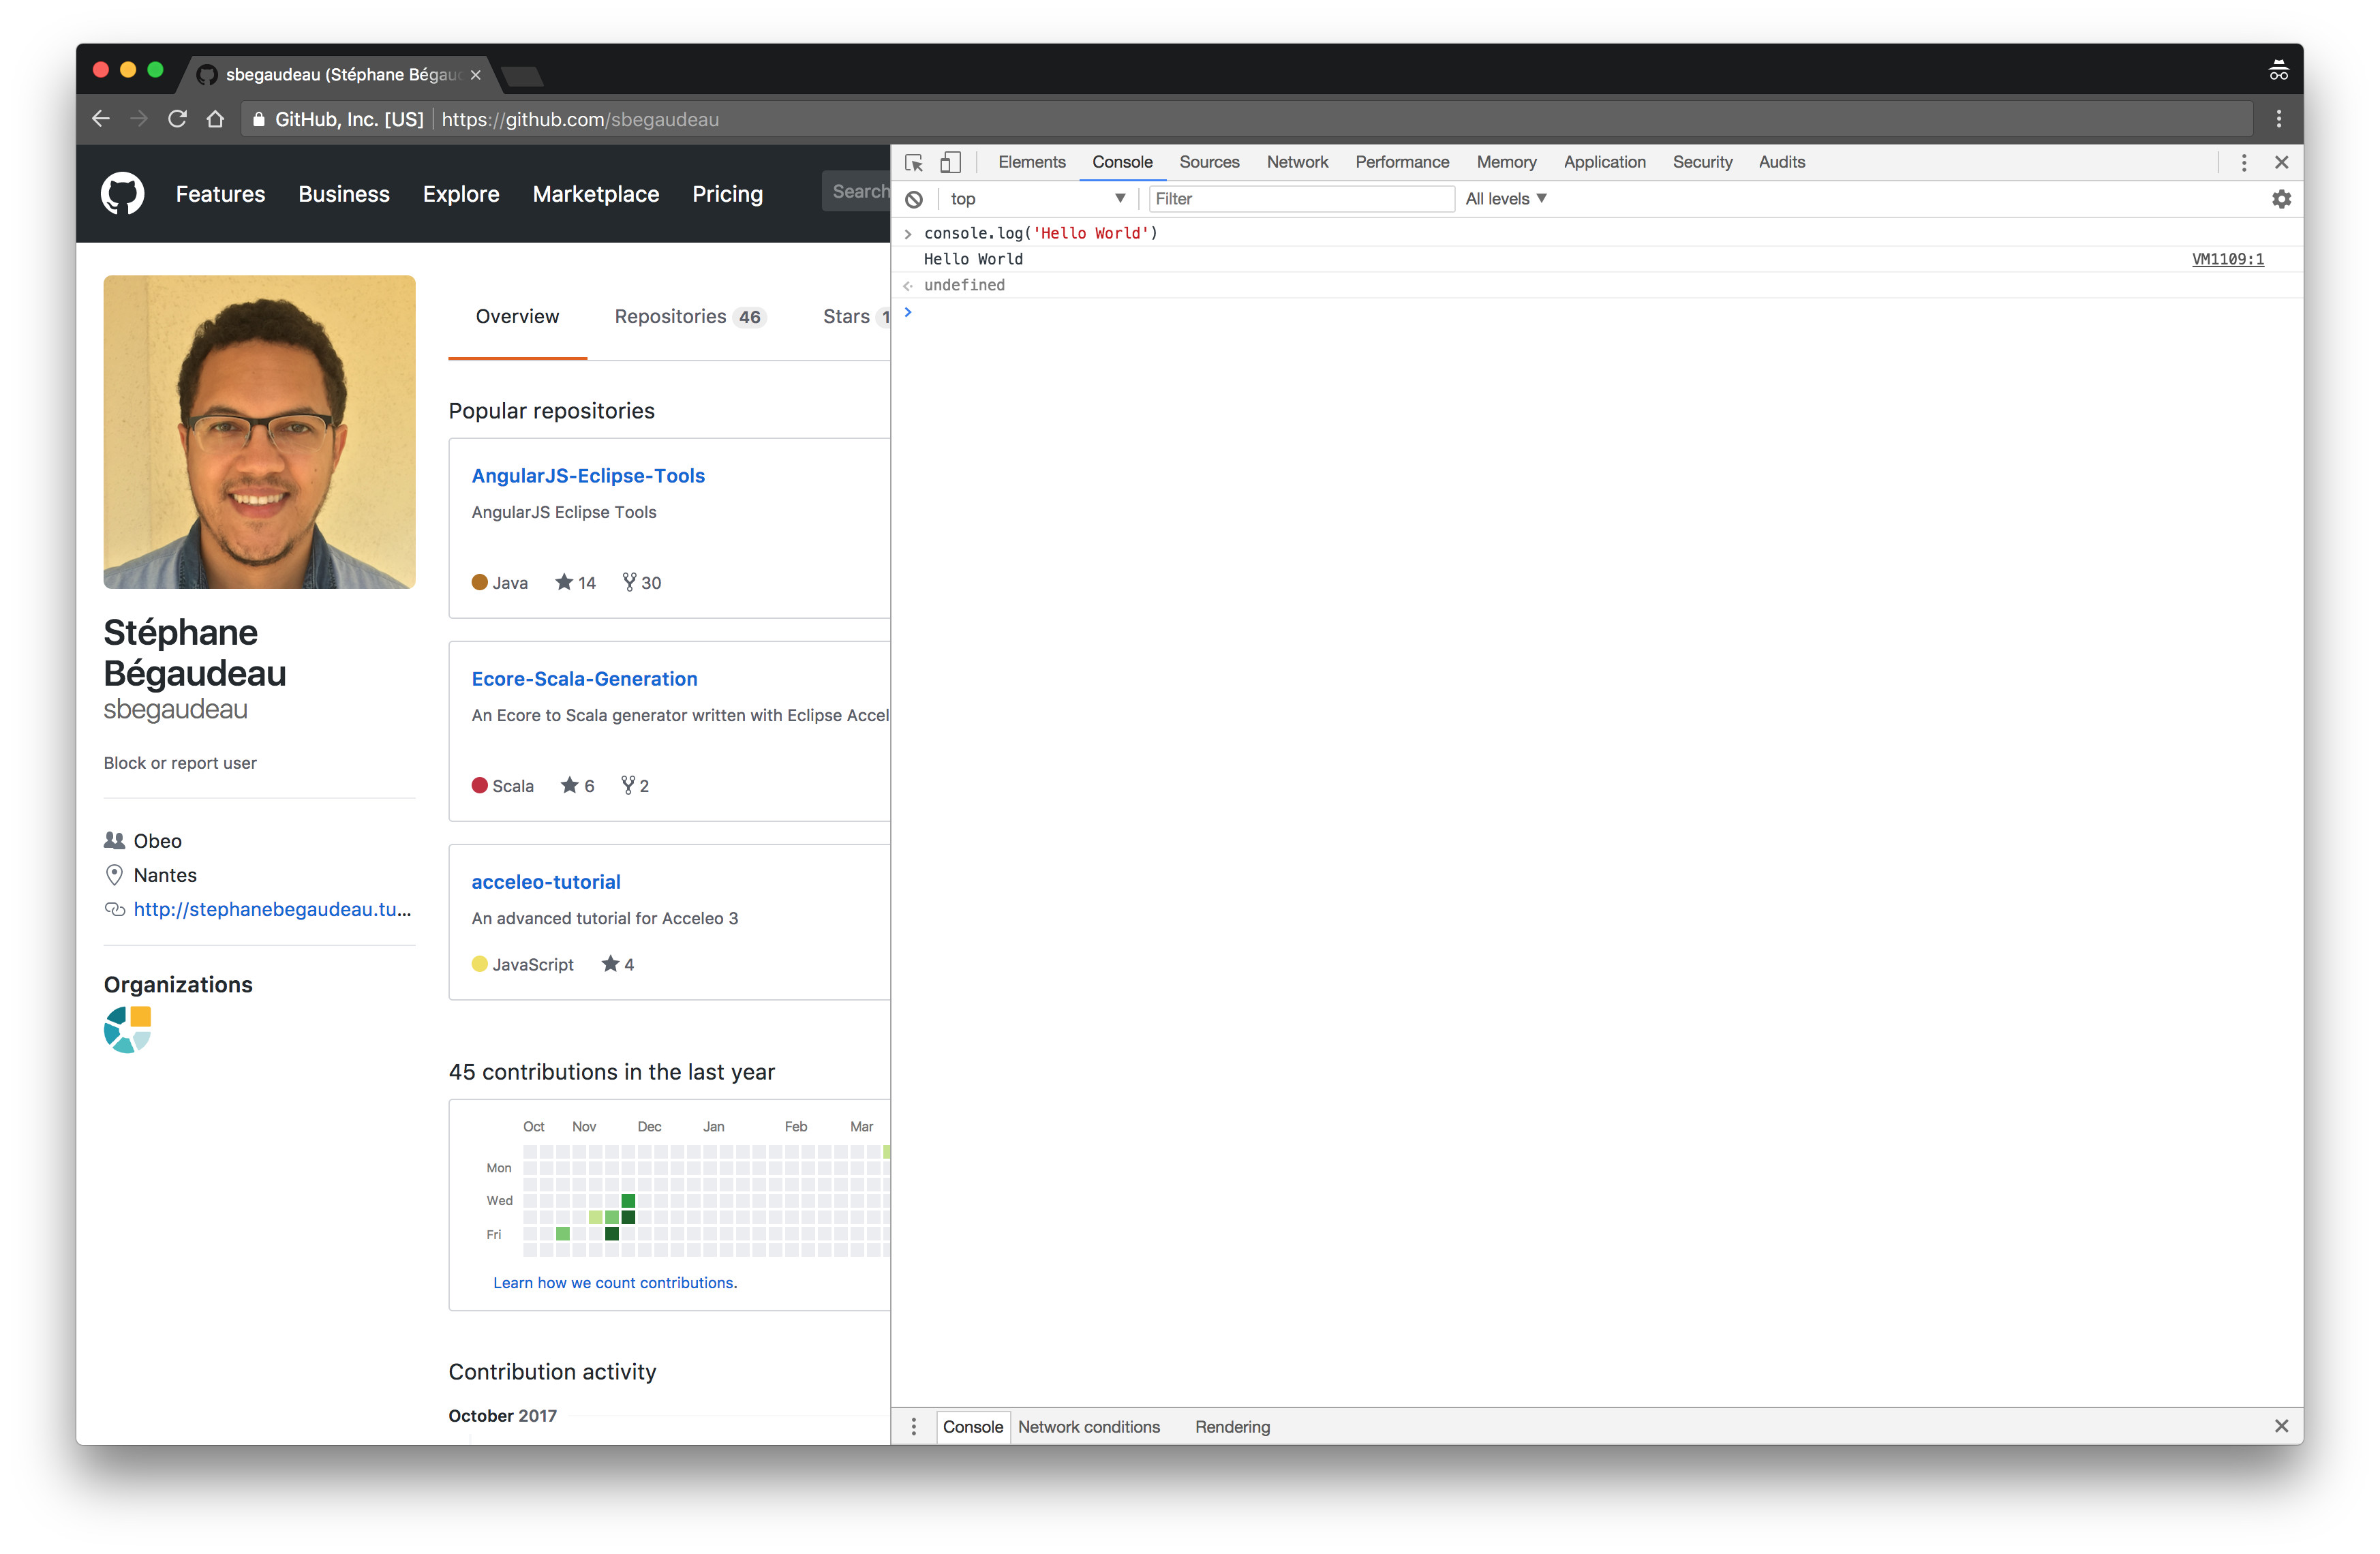
After reviewing how to debug the DOM in the first part of our overview of Chrome Devtools, in this second part we will have a look at the Console. A Console tab is available both as a main tab at the top of the Devtools and as a drawer at the bottom of all the other tabs. Both versions are identical and they provide the same features. The Console allows you to type some JavaScript code, evaluate i...

Chrome Devtools - Part 1

Most web developers should know it by now but the Chrome web browser embeds an amazing set of development tools. The Chrome DevTools are organized thanks to a collection of tabs used to group relevant tools in categories. In this post, we will start reviewing some of those tools. You can open the Chrome Devtools by using the contextual menu on any element of the current web page and selecting Insp...