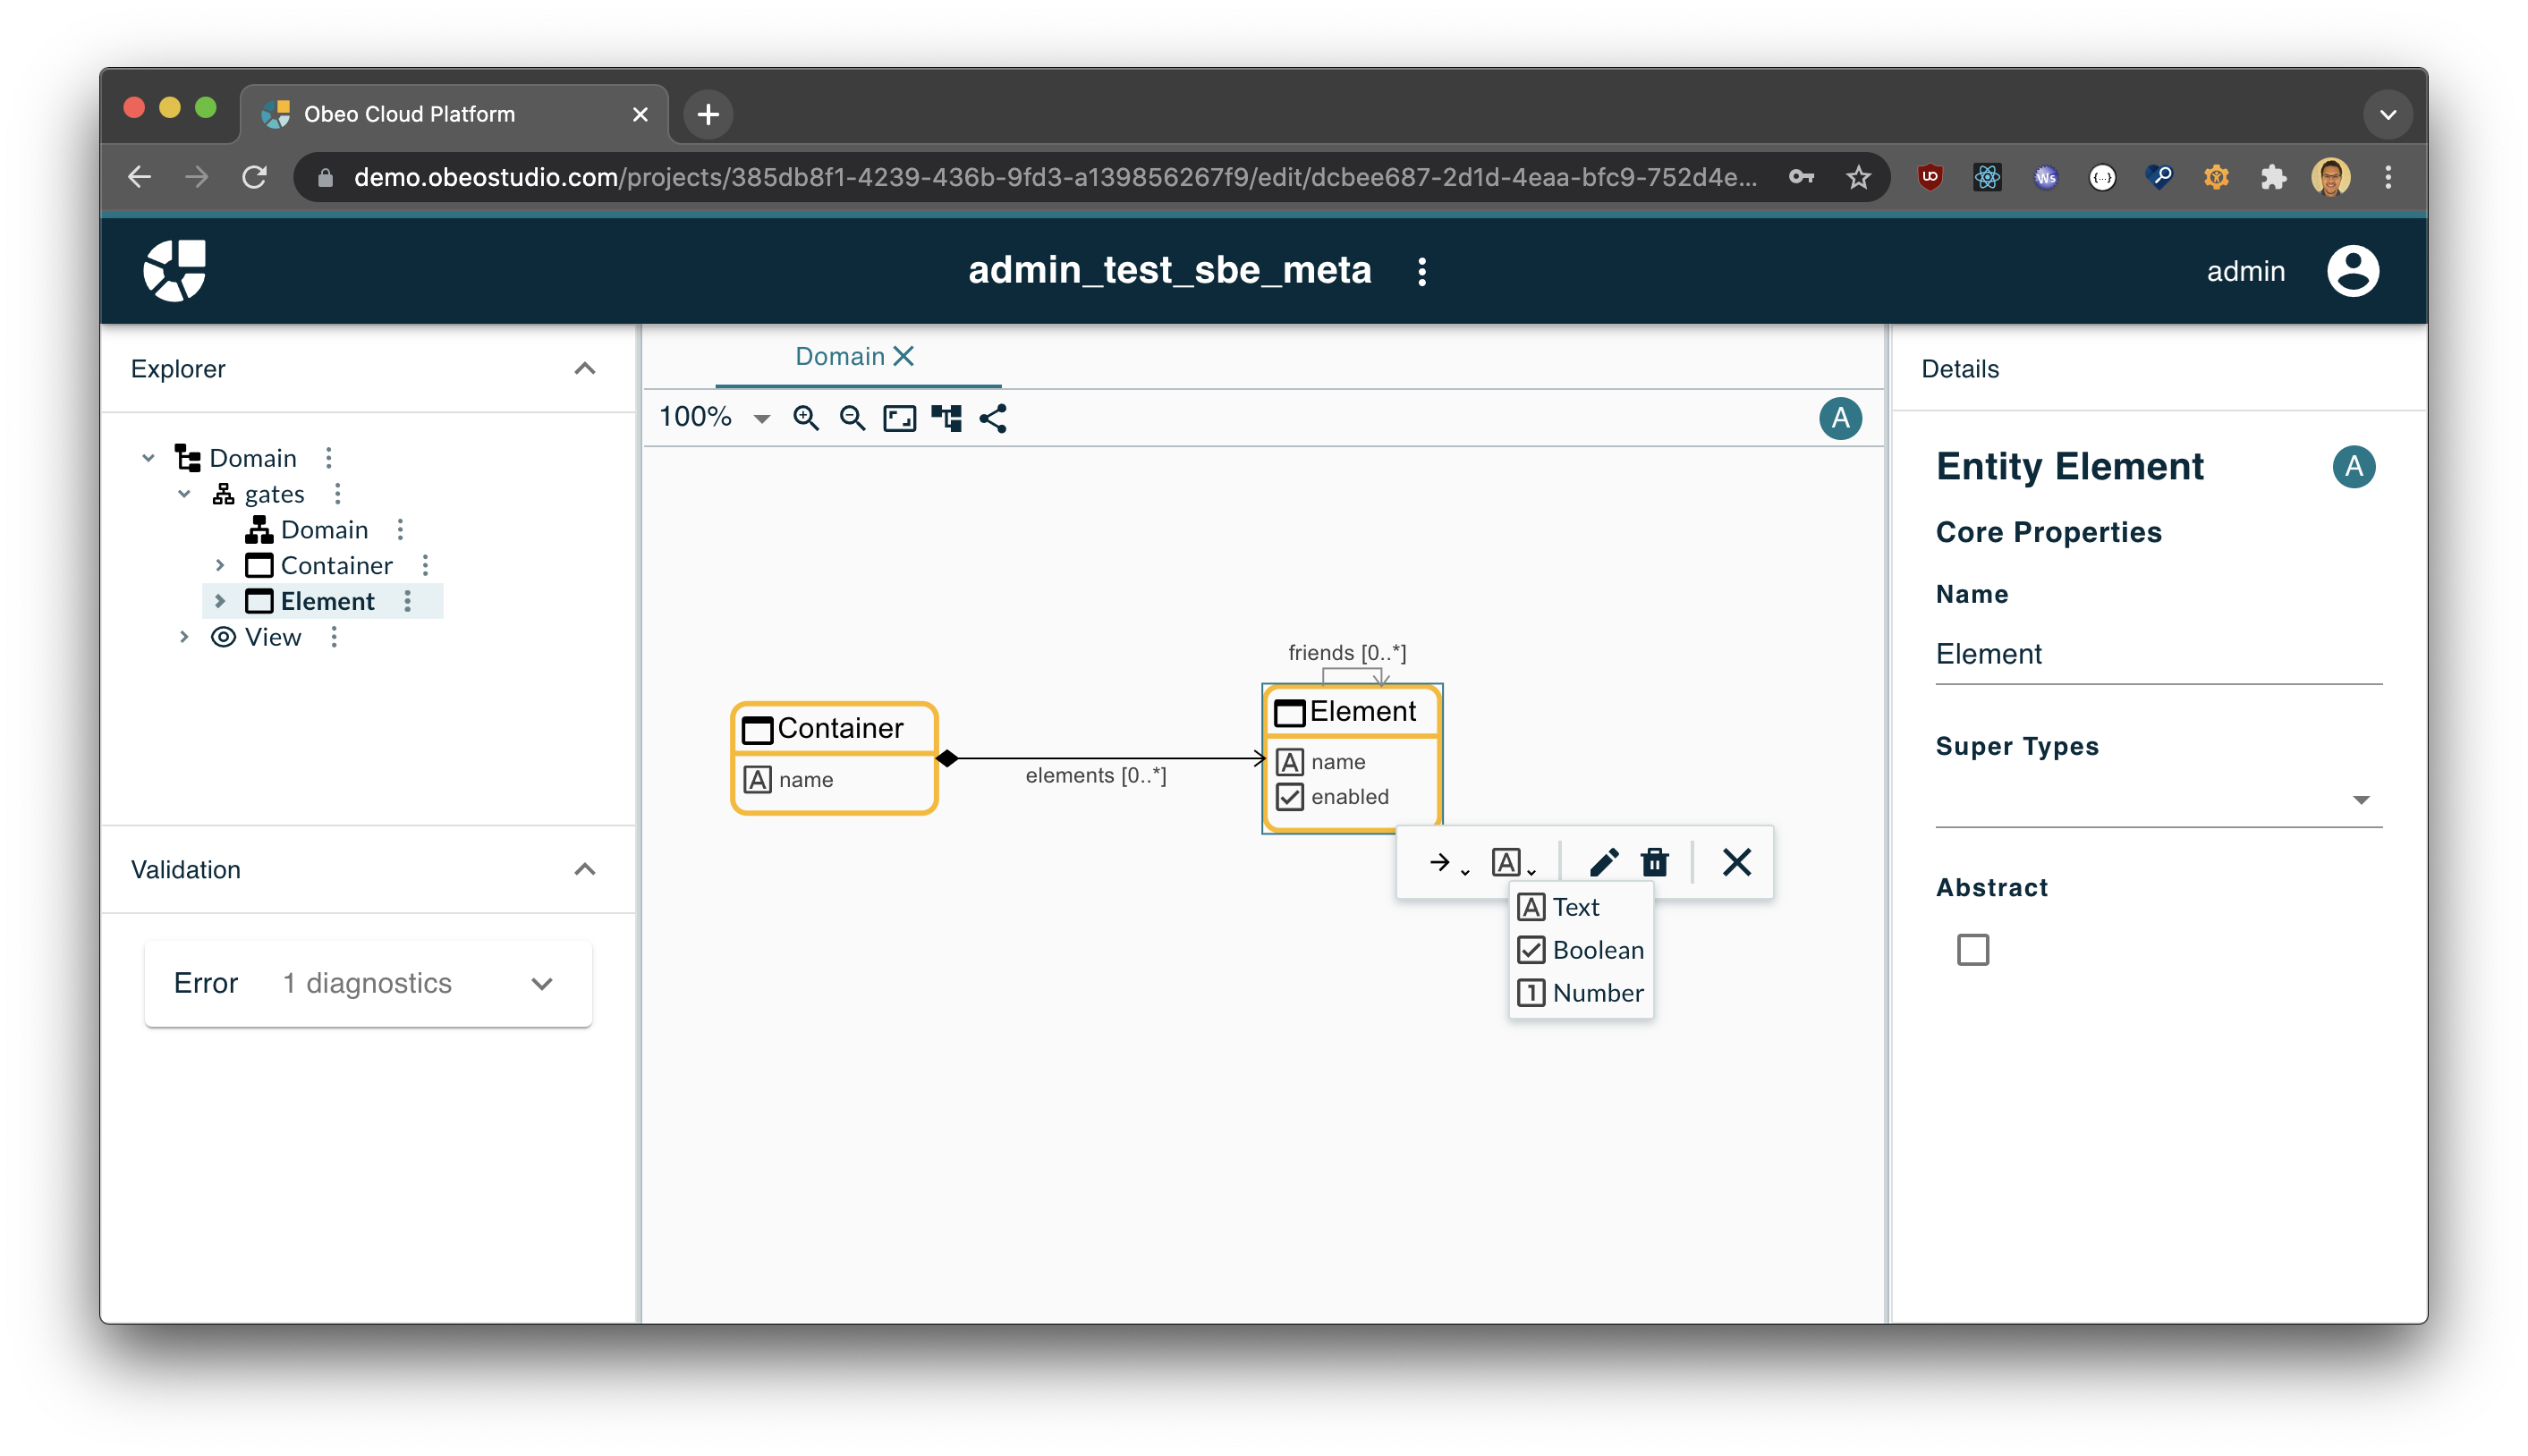
Capella Add-ons: Collaborate better + Generate Docs

When Capella was made open source in 2014, feedback was collected from early users and adopters. The feedback showed several topics were important to the open source community. First and foremost, users wanted to learn how to efficiently collaborate on a single Capella model and minimize configuration and version management problems. Second, users wanted to generate their documentation efficiently...

Eclipse Sirius, the technology behind Capella

As the state-of-the-art engineering tool vendors did not provide the appropriate offer, Thales decided in 2007 to develop its own Model-Based Systems Engineering (MBSE) method and workbench. This initiative resulted in Arcadia and Capella. To reduce the complexity and the cost of developing such a custom modeling tool, Thales worked with Obeo to create a new technology that could facilitate the cr...

Capella Industry Consortium

Capella is a model-based engineering solution that leverages the Eclipse platform to implement an adaptable and extensible workbench. Natively supporting an innovative Model-Based Systems Engineering (MBSE) approach based on both industrial experimentations and system engineers’ feedback, it can be customized to fit the specific needs of many industrial domains. Made open source in 2014, a vibrant...

Why Capella? Taking on the Challenges of Complex Systems Engineering

In a world moving at an ever faster pace, Capella is an open and field-proven approach to address increasing complexity in systems architecture and solve the limitations of traditional engineering practices that are primarily driven by documents. Launched in 2007 by Thales, this initiative resulted in the definition of Arcadia, an engineering metho...

Chrome Devtools - Part 3

After having a look at the debugging of the DOM first and then all the secrets of the Console in the second part, in the third part of this analysis of the Chrome Devtools, we will detail the tooling provided by Chrome to view, edit and debug our code thanks to the Sources tab. The Sources tab is divided into four different areas, on the left, the navigator is available with various drawers like S...

Chrome Devtools - Part 2

After reviewing how to debug the DOM in the first part of our overview of Chrome Devtools, in this second part we will have a look at the Console. A Console tab is available both as a main tab at the top of the Devtools and as a drawer at the bottom of all the other tabs. Both versions are identical and they provide the same features. The Console allows you to type some JavaScript code, evaluate i...

Chrome Devtools - Part 1

Most web developers should know it by now but the Chrome web browser embeds an amazing set of development tools. The Chrome DevTools are organized thanks to a collection of tabs used to group relevant tools in categories. In this post, we will start reviewing some of those tools. You can open the Chrome Devtools by using the contextual menu on any element of the current web page and selecting Insp...